
Summary
Summary
Tanzania Conservation Resource Center (TZCRC), working with partners Development Seed and the Tanzania Wildlife Research Institute (TAWIRI), collectively developed an innovative AI-assisted methodology to increase the speed of spotting and counting wildlife, human activities, and livestock after aerial surveys. This report outlines our methodology to conduct an AI-assisted survey and subsequent analysis to produce maps of wildlife and human distributions together with a proximity map of potential conflict areas between wildlife and the human-associated activity across survey areas.
Wildlife conservation is in a race against human expansion worldwide. The expansion of settlements and agricultural lands coupled with a three percent population growth annually in sub-Saharan Africa makes it difficult to protect wildlife and its habitat. The proximity of humans and wildlife creates the potential for conflicts through competition for resources and space. Wildlife corridors are diminishing rapidly in many parts of sub-Saharan Africa due to this competition. At the same time, wildlife activity can lead to loss of income, property, and sometimes human lives for those that live and work close to wildlife habitat.
Survey systems that capture human and wildlife distributions on the ground inform policy crafted by conservation practitioners, policy-makers, and local residents who have the shared goal of mitigating conflicts. However, survey systems require high costs for frequent monitoring and tracking of human, wildlife, and livestock activities and movements. Currently in Tanzania, aerial surveys are the primary method for understanding wildlife-human proximity. These surveys typically happen on three to five year intervals due to high logistical costs and the difficulty in fielding logistics, flight crew, fieldwork, and analysis teams in remote locations. New survey methods with automated camera systems speed up detection and decrease implementation costs, but produce tens of thousands of images and require intensive labor efforts to sort through images.
This project utilized two different types of image capture from aerial censuses: traditional Rear Seat Observer (RSO) censuses (using human-eye detection) and photographic aerial surveys (PAS)1,2. We relied on images that were captured during RSO censuses for machine learning model development. The Tanzania Wildlife Research Institute provided annotators (wildlife domain experts) at a small annotation lab in Arusha, northern Tanzania, to process a database of images from RSO survey counts in Tanzania collected by TAWIRI in the past decade. Labels were annotated by a group of volunteers. Around 7,000 RSO images were labelled.
At the end of the project, we present two AI-assisted Aerial Imagery Analysis (AIAIA) systems: 1) an image classifier, AIAIA Classifier, that filters images containing objects of interest from tens of thousands of aerial images using automated camera systems and 2) a set of three object detection models, AIAIA Detectors, which locate, classify and count objects of interest within those images. The detected objects were assigned to image IDs that have their unique geolocation recorded during the aerial surveys. These geocoded detections were then used to generate maps of the distribution of wildlife, human activities, and livestock, with a visualization of mapped proximity highlighting potential conflict areas. Explore the map here.
Specifically, the image classifier, AIAIA Classifier, filters an image containing our objects of interest, either human activities, wildlife, or livestock. Each object detector model, AIAIA Detectors, separately locates either wildlife and livestock at the species level or human activity. The models were containerized and registered to Azure Container Registry. The model training sessions were deployed with Kubeflow on Azure Kubernetes Service with GPU instances. The sessions were also tracked by TFJob for hyper-parameter tuning and search experiments. Such model training is monitored by Tensorboard so we can watch model performance over validation dataset. The best performing models were selected and containerized as TFServing images, including the classifier and detectors (called “aiaia-fastrrcnn”) that hosted on Development Seed’ DockerHub for our scalable model inferences, see TFSeriving images here. Our AIAIA classifier processed 12,000 image chips (400x400 pixels) per minute, and we were able to process 5.5 million images under 8 hours. The AIAIA detectors each processed 172 images per minute on a K80 GPU machine.
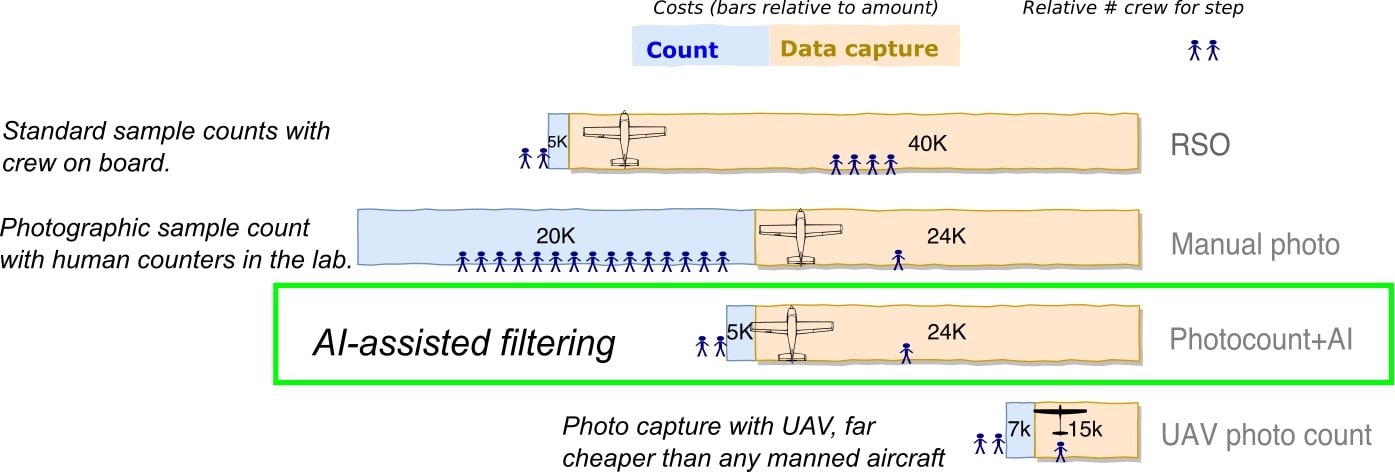
Our AIAIA introduces a workflow that: 1) can speed up the processing of wildlife counts and mapping human influences in wildlife conservation areas up to 60%; 2) it has the potential to reduce the implementation costs of counting by up to 20%, which will enable more frequent monitoring. Once the training data quality, and model performance of AI assisted workflow mature and stabilise, we foresee the hours spent on getting accurate human-wildlife proximity maps would only take 19% of current human manual workflow, and potentially reduce cost of identifying and counting objects over 81,000 aerial images from $20,000 to less than $5,000 (See the following graph).
While it is promising to use AI-assisted imagery analysis, however, AI-assisted workflow is still not perfect. The quality of outputs heavily depends on the quality of the training dataset we supply to the models. In our case, the annotation task was relatively new to all the volunteer annotators, and our aerial images were challenging to annotate for a variety of reasons, e.g. the objects of interest are small, hard to identify because the lighting, angle of the shots, the body size and colors of objects. We observed the following quality issues in the training data:
-
Missing labels. Some wildlife, livestock, or human activities were not annotated in images, particularly when the condition of the image was blurry, situated in a complex landscape, or contained many objects
-
Label duplication. Some objects were annotated twice or more, leading to further class imbalance as well as less accurate validation and test metrics due to an increase in false negatives from missed detection of the duplicate label.
-
Mislabeled. Particularly for the wildlife categories and livestock, many instances were mislabeled as different classes. We also include mislabeled classes when multiple objects are mixed under one class.
Each of these problem types varied in degree depending on the difficulty of the class that was being annotated. These issues were overall consistently present in the training and test datasets. This made the AIAIA Detectors more difficult to accurately train and caused the evaluation metrics to be less robust, since many ground truth labels were incorrect. We discuss these issues in detail in the main report, see section “Results and Discussion”.
Even with training data quality issues, our classifier model achieved a > 0.84 F1 score with the test dataset. The best performing classes for the wildlife, livestock and human activities detectors were buffalo (.48 F1 ), cow (.29 F1 ), and building (.49 F1), with each class having higher precision than recall. Other categories had high performance in terms of precision (meaning less false positives), while recall (the ratio of true positives to all groundtruth) suffered, including the following: elephant (.59 precision, .17 recall), smaller ungulate (.85 precision, .24 recall), and shoats (.69 precision, .14 recall). This high precision shows that our model is capable of correct, high confidence predictions and the recall metrics show that it has trouble with separating all ground truth from the background. Low recall scores generally imply poor training dataset quality. We expect that addressing training data quality issues and either discarding classes with low amounts of samples or increasing the amount of samples will substantially improve both recall and precision for our object detection models.

The results from AIAIA detectors were re-imported back to the Computer Vision Annotation Tool (CVAT) tool for human-in-the-loop validation before the detected wildlife, livestock and human activities were geocoded for human-wildlife proximity map. Currently, the server of the CVAT tool is set up on Azure. CVAT is a free, online, interactive image annotation tool for computer vision tasks that we used to create original training datasets for our AI model development. For model results validation, the tasks are splitted by multiple jobs to allow multiple users login and synchronically work parallely on CVAT.
The future AI-assisted workflow will highly benefit from having a human-in-the-loop approach to improve training data quality by helping annotators to only annotate images with objects in them, annotate difficult classes, and fix incorrect groundtruth. We proposed the future AI-assisted workflow should bring humans into the loop in a three phase workflow: 1) training dataset visual inspection and validation before the AIAIA Classifier model training; 2) AIAIA Classifier model output inspection before the filtered images are passed to the AIAIA object detectors; 3) manual output inspection, validation, evaluation and correction before the detected, identified and counted objects are aggregated for the minimum viable product (MVP) visualization to produce proximity and risk maps. Improving training data quality is critical for our AI-assisted workflow.