
Metodology and Results
AIAIA Detectors
Model performance
Each AIAIA Detector was evaluated by sorting model results into four categories:
- True positives, where a wildlife object received the correct bounding box and class from the model.
- Misidentifications, where the bounding box was correct but the class was incorrect
- “False Positives, detection only” where a detection was made without ground truth
- And “False Negative, groundtruth only” where no detection was made where a ground truthed object existed.
The criteria for a detection to be a true positive or misidentification was that the intersection-over-union (IOU) of their bounding boxes had to be greater than or equal to .5. In cases where multiple detection bounding boxes overlap a ground truth box, the detection with the higher confidence score was chosen to be a true positive and the other was deemed either a false positive or other category if it overlapped a different ground truth box.
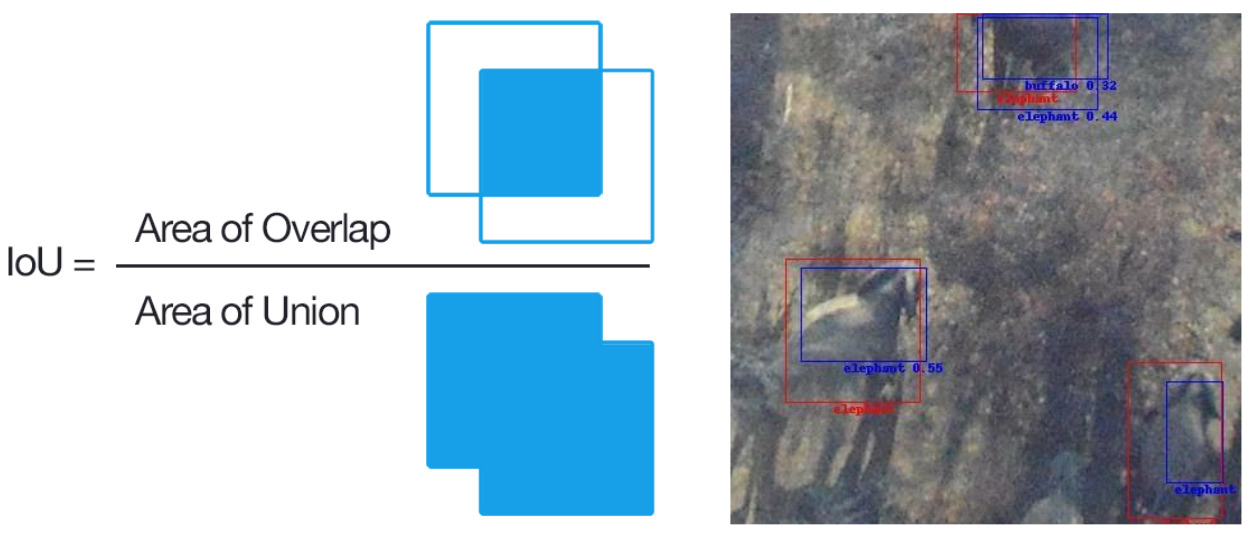
These results were compiled into two confusion matrices, one in units of proportion of predicted positives for each class, and another matrix in units of absolute counts. Each matrix shows information about detections for each combination of model categories, including true positives, misidentifications, false negatives and false positives. True positives appear along the diagonal of each matrix. The bottom row of each matrix (“false negative, groundtruth only”) shows information about the number of detections where there was no corresponding ground truth of any class. The rightmost column of each matrix shows information about the number of groundtruth without corresponding detections of any class (“false positive, only detection”). Row values in the proportion matrix sum to 1, and the row values in this matrix should only be compared along one individual row at a time, not between rows since proportions are computed for classes with different sample sizes.
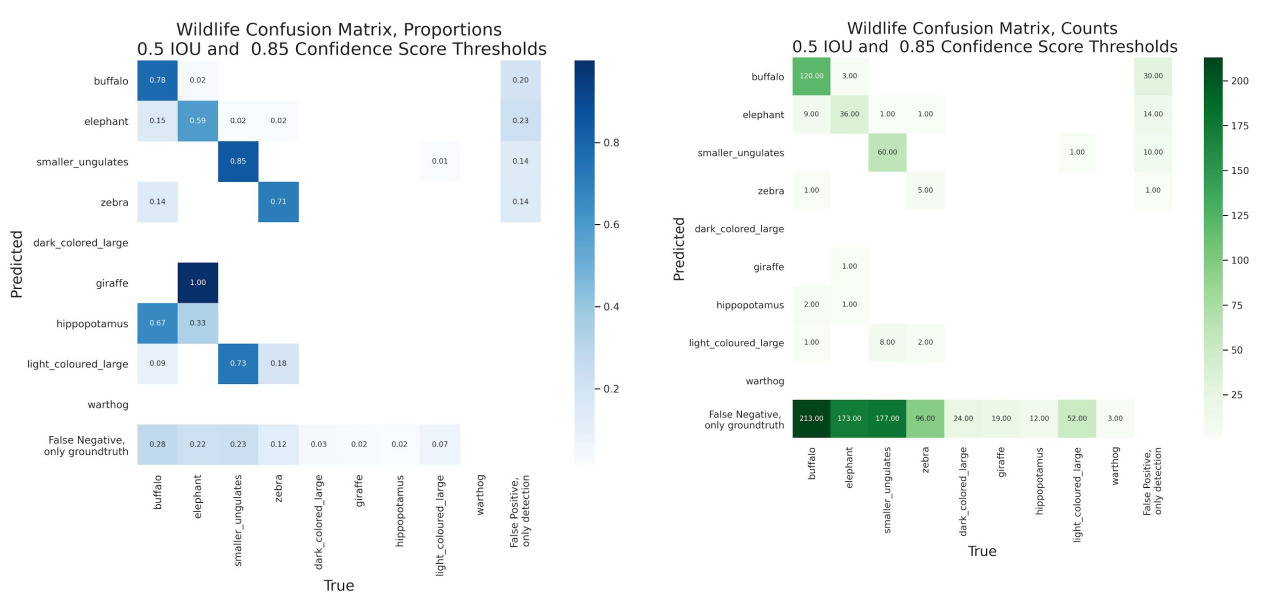
- The wildlife model performance at a .85 confidence threshold showed strong majorities of correct, positive predictions for the most represented four wildlife classes: 78% for buffalo, 59% for elephant, 85% for smaller ungulates and 71% for Zebra.
- There was some confusion between the buffalo and elephant classes. 15% of predicted elephants were annotated as buffalo. 2% of predicted buffalo were annotated as “elephant”.
- Smaller Ungulates had the smallest proportion of predicted positives as false positives with no corresponding groundtruth, at 14%.
- For the three most represented classes, there were more “false negative, groundtruth only” samples than true positives.
- The elephant class had almost five times as many “false negative, groundtruth only” as there were true positives. Smaller ungulates had almost three times as many missed false negative detections relative to true positives.
- Aside from these three well represented classes and the zebra class, there were no true positives. Most other samples from other classes fell under the “false negative, groundtruth only” column.
- Of the top three classes, the Elephant and Smaller Ungulates classes had a notably lower recall compared to precision. The Buffalo class had more even performance in terms of false positives and false negatives.
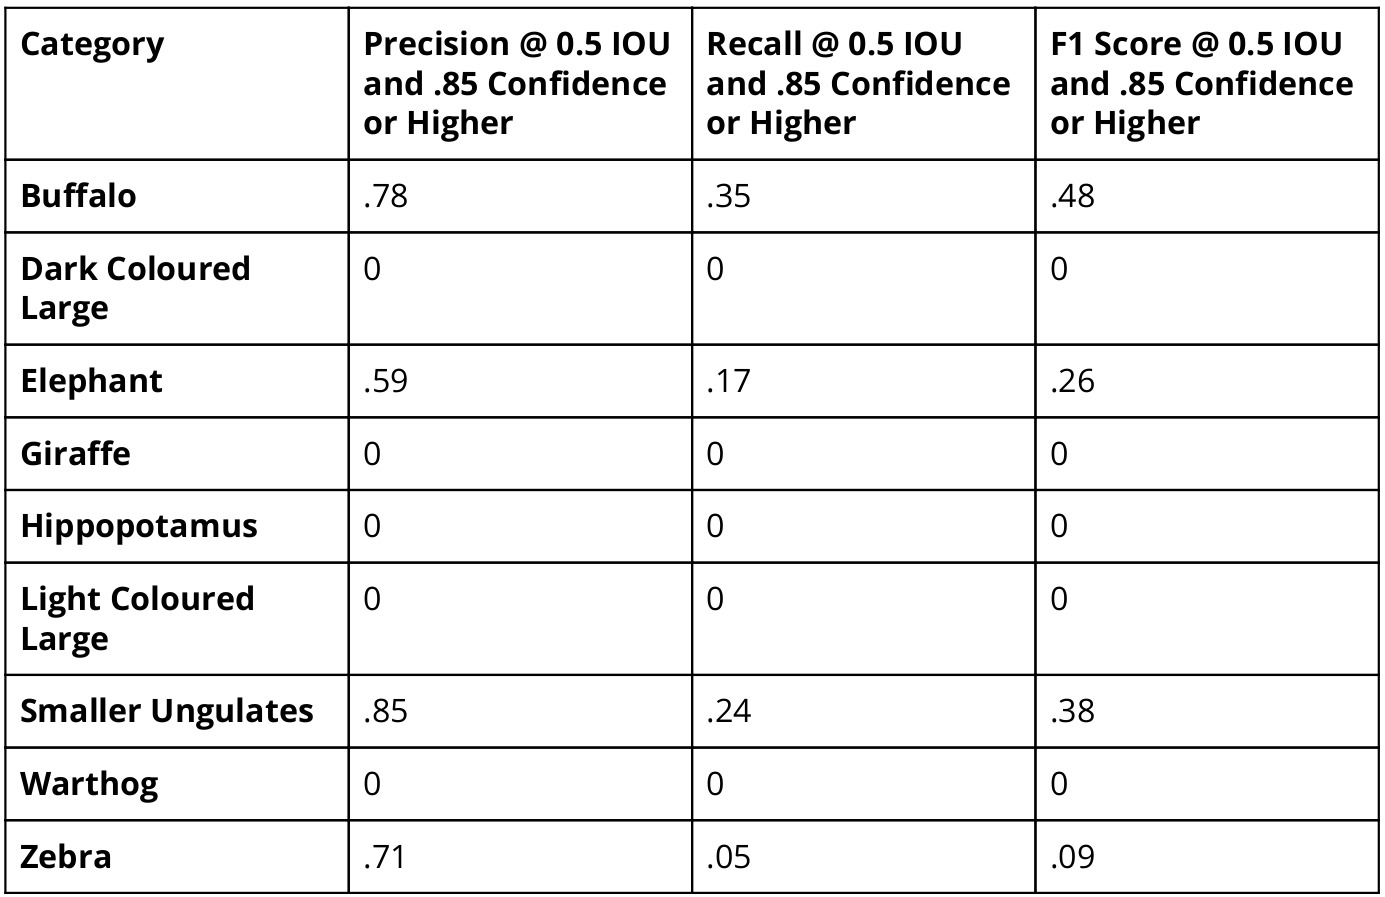
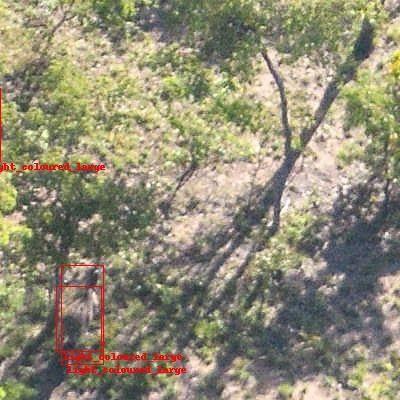
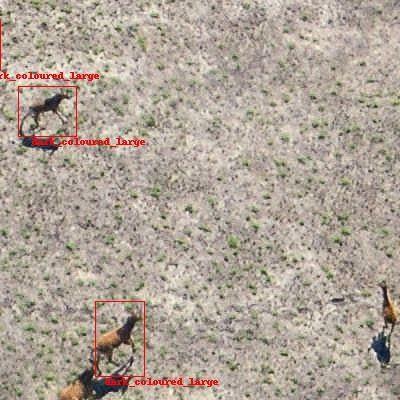
- Giraffe, Light Coloured Large, Smaller Ungulates, and Warthog did not achieve any true positive detections and therefore received a score of zero for each of the metrics.
- Dark coloured large received one true positive and most zebra ground truth went undetected, causing low scores for these classes .
- Buffalo, Smaller Ungulates and Elephants were generally the best performing classes and were also the most represented in the test and training sets.
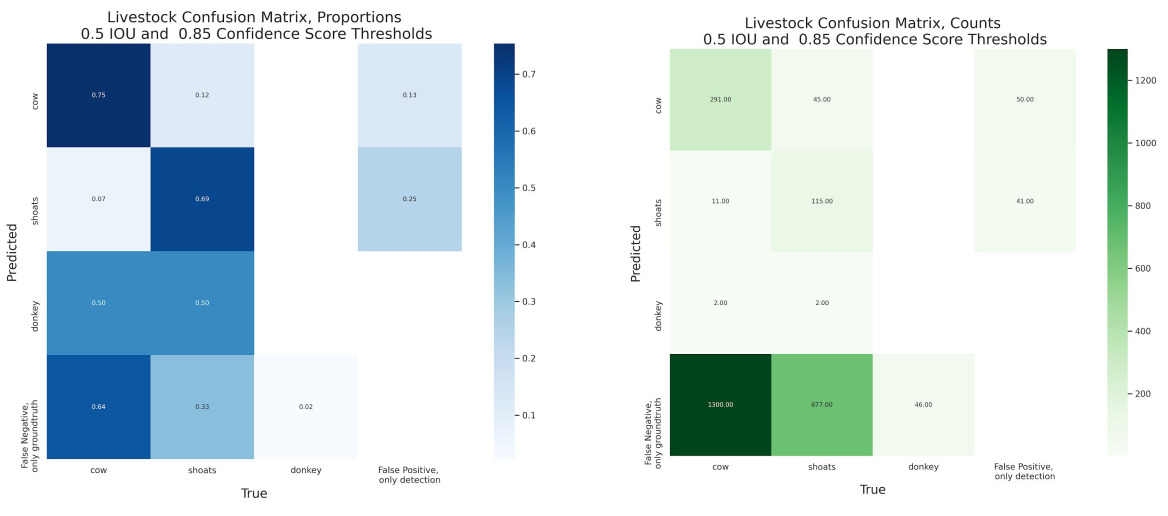
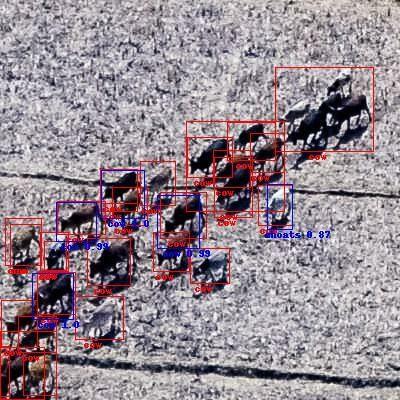
- The livestock model performance showed a strong majority of positive predictions of the two dominant classes were correct, with 75% for cows and 69% for shoats.
- There was some confusion between the cow and shoats classes. 12% of predicted cows were annotated as “shoat”. 7% of predicted shoats were annotated as “cow”.
- Cows had the smallest proportion of predicted positives as false positives with no corresponding groundtruth, at 13%.
- Performance for both shoats and cows experienced many more “False Negative, only groundtruth” than true positives.
- For the cow class, there were 50 “False Positive, only detection” compared to 291 true positives. The shoats class had a higher number of “False Positive, only detection” (41) relative to true positives (45) than the cow class.
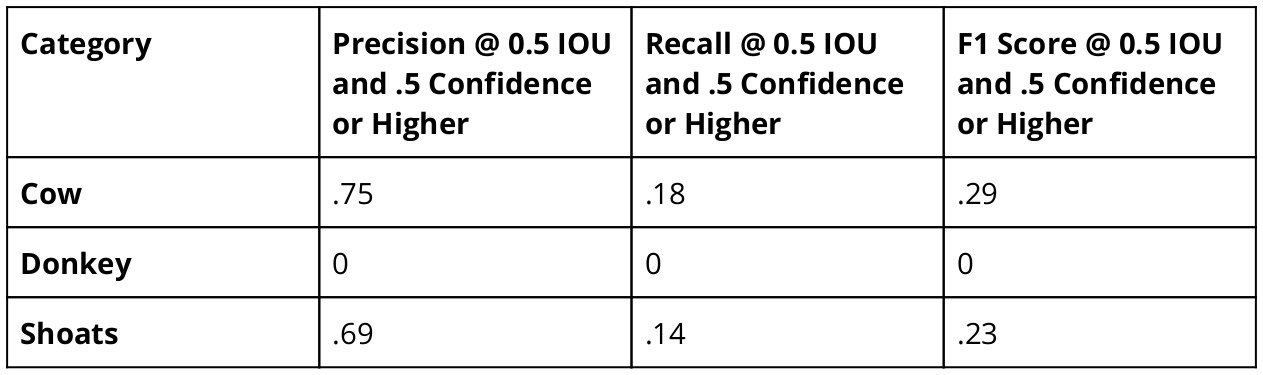
- In our test set, the Donkey class did not achieve any true positive detections and therefore received a score of zero for each of the metrics.
- The Cow and Shoats classes had a notably lower recall compared to precision, meaning there were a higher proportion of false negatives for these classes than false positives.
- The cow class had substantially higher precision than shoats, which resulted in a higher F1 score.
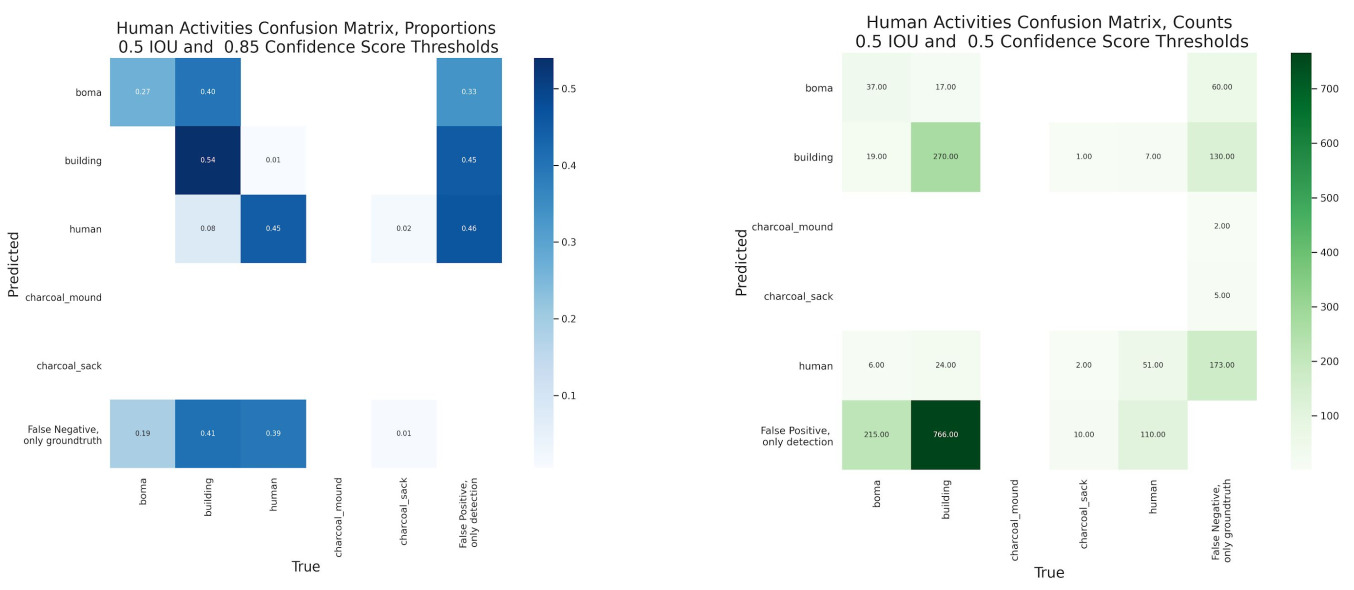
- The human activities model performance showed varied performance across the most represented classes (boma, building, human).
- 54% of positive building predictions were correct for buildings, 45% for humans, and 27% for boma.
- Predicted boma was confused with ground truth building more often than boma was correctly predicted (40% vs 27%). However there were a lack of positive boma samples to make this statistic robust.
- There were considerable false positives as a percentage of all positives for boma, building, human (>30%).
- The counts for the human activities model showed higher “false negative, only groundtruth” for the boma, building, and human classes.
- No charcoal mound or charcoal sack samples were correctly detected or misidentified, and there were few samples available in the training and test sets.
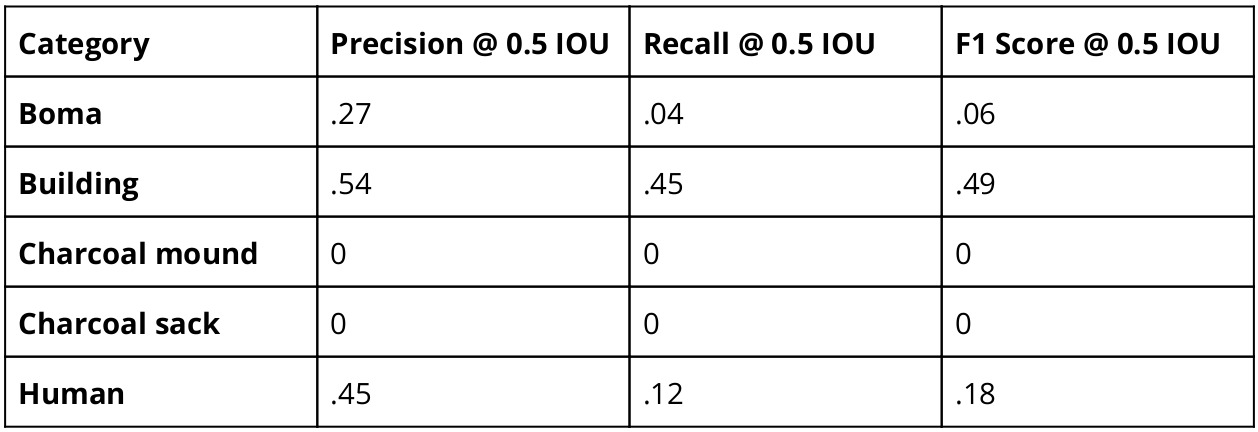
- The Boma, Human, and Building classes were the best performing classes and were also the most represented in the test and training sets for this model.
- Of the top three classes, the Building class had a notably higher recall and F1 score compared to the Boma and Human classes. The Boma and Human classes both had very low Recall but comparable precision scores to the Building class.
- In our test set, Charcoal mound and Charcoal sack did not achieve true positive detections and received a score of zero for each of the metrics.
Model Inference
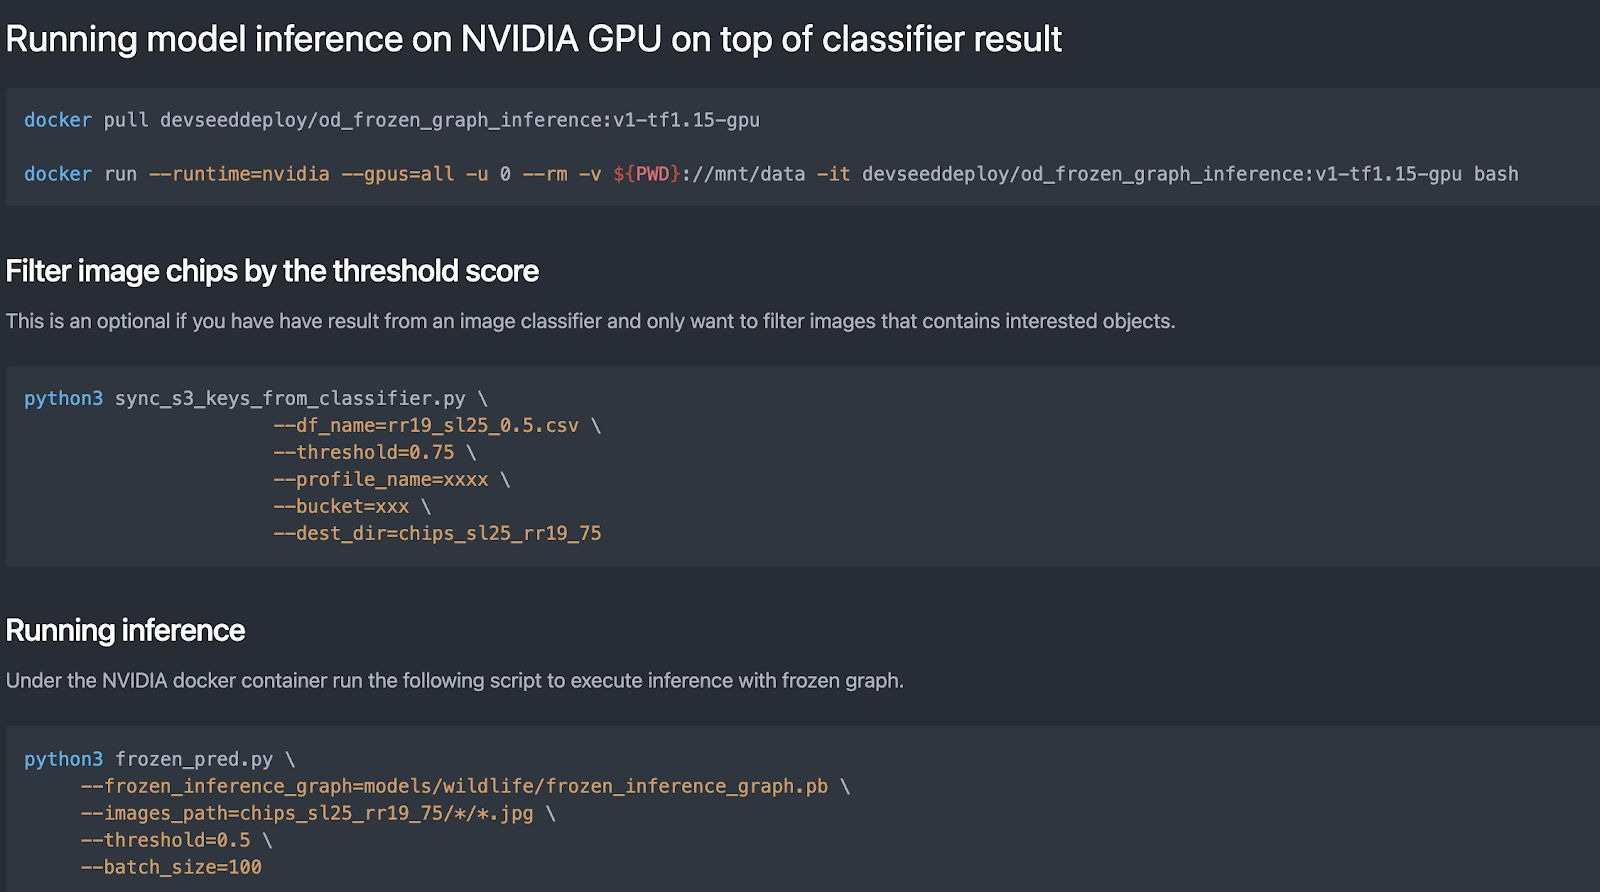
Once the model training session finished for each detector, we containerized the models as TFServing images and uploaded them to Development Seed’s DockerHub. These images are open and available for anyone to download them. They will run anywhere Docker runs, which makes them usable across all cloud environments and any modern computer. The steps to download and use these TF Serving images are listed within the documentation on each DockerHub page, and each model has a GPU and a CPU version. However, Fast-RCNN ResNet 101 is a heavy backbone model. We recommend the GPU version of TFServing images for model inference.

Please note: because the TFServing images ran at a speed of 14 second/image on a single NVIDIA K80 GPU, we ended up running model inference on an equivalent GPU by loading the exported model’s frozen inference graph directly. The inference speed using the frozen graph was at 0.35 second/image or 172 images per min. Inference for three detectors was done parallely on three GPUs and finished within 15 hours, processing 150,141 images.
Discussion and Conclusion
Our results show that the AIAIA Detector had some success when it came to precision and less success when it came to recall. Lower recall scores imply poor training data quality. Buffalo, Smaller Ungulates, and Cows had precision scores greater than or equal to 75%, meaning that users of these models can have some confidence that a positive prediction for any of these classes is in fact the correct class. If it is not a correct class, in some cases the prediction is a similar looking class. Next, other classes that were well represented but had lower precision scores were the Shoats (69%), Elephant (59%), and Building (54%) classes. This means that users of these models should be more cautious when using these detections to distinguish true positives from false positives. Nevertheless, these predictions still help to filter down potential locations where wildlife, human activities, and livestock coincide, allowing for an analysis of HWP.
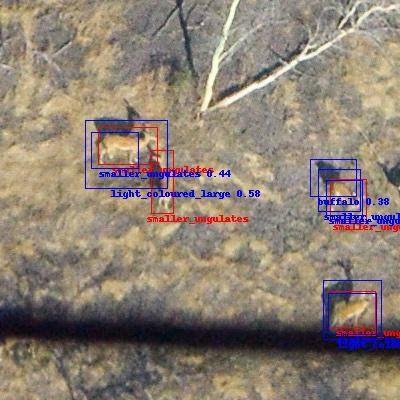
While users can gain useful, high confidence predictions from the model, these predictions will not consist of a full census of potentially detectable wildlife, human activities, or livestock. The model had more issues with false negatives than false positives, and we expect this is primarily due to training data error. Examples of this include duplicate ground truth labels, missing groundtruth, and cases where a single box was drawn around a crowd of objects. The ground truth shows as red color boxes and text and the predictions are in blue.
| Duplicate Labels | Missing Labels | Crow Labeling |
|---|---|---|
 |
 |
 |
These errors in the annotations both skewed the training of the model and skewed the evaluation process, since the model’s correct detections would not be evaluated properly with these incorrect labels. We also observed negatives due to very blurry images and images where the animals were far away. The objects in these images look very different from cleaner images.
| High Image Quality Zebras | Poor Image Quality Zebras |
|---|---|
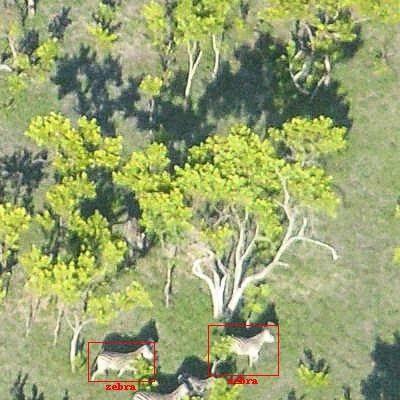 |
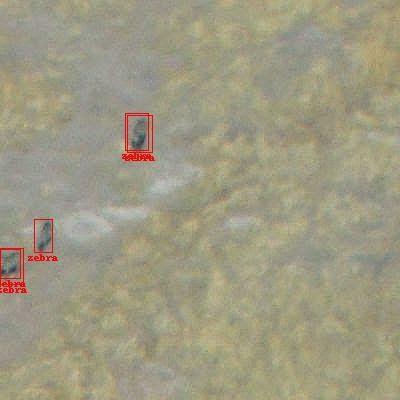 |
We also manually observed actual false positives in our testing set, particularly in images with shadows and blurry images.
| Duplicate Detection of Shadow | Blurry False Positive |
|---|---|
 |
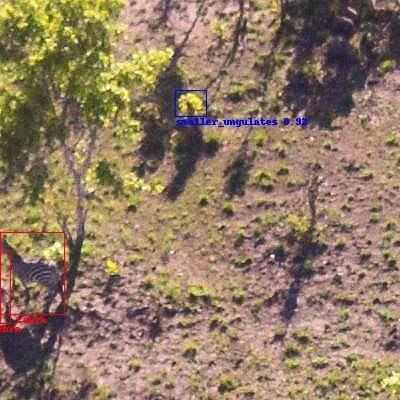 |
These aspects of training image quality impacted both precision and recall. In many cases, image quality was poor enough such that subcategories of wildlife could not be distinguished and so they were potentially misannotated. Future iterations of this model could benefit from using coarser class hierarchies or simpler class hierarchies with fewer classes. Particularly for the wildlife model, classes like dark coloured large and light coloured large could be merged into the smaller ungulate class, since these two classes appeared to exhibit similar image features from manual inspection. Light coloured large was also confused with smaller ungulates more often than there were correct predictions, and dark coloured large had no predictions (false or true) at all. A simpler class hierarchy would enable the AIAIA object detection models to train on a less complex classification problem by not attempting to separate classes with too few samples, inconsistent labels, and compromised image quality. It would also make the annotation task less intensive, leading to higher quality labels. Overall, improving the quality of annotations is the most important way to improve model performance and confidence in the assessment of model performance.
One way to quickly improve training data quality is to use a human-in-the-loop approach, where a machine learning model assists a human annotator by filtering down the images they need to annotate and/or making predictions that a human annotator can verify and edit more quickly. For example, using this existing set of AIAIA object detection models, human annotators can work with a set of predictions made for some of the less common classes, like zebra, edit these predictions, and correct inaccurate predictions. Then, future models trained on this improved dataset will suffer less from class imbalance during training and testing. The AIAIA image classifier can also be used to preselect image chips with a higher likelihood of containing an object of interest so that annotators spend more useful time annotating images and less time sifting through images without objects of interest.