Methods
Large commercial farms
We used multiple satellite sources to map large commercial farms in Ethiopia, although we relied primarily on a Sentinel-2. We first developed a Sentinel-2 false-color mosaic from a combination of bands 11 (SWIR), 8 (NIR) and 2 (blue), highlighting agricultural areas across Ethiopia. Using this mosaic, we then mapped large-scale agricultural areas using JOSM, a map editor for OpenStreetMap (OSM), and other high-resolution satellite imagery sources as a cross-reference when plot boundaries were not clear in the Sentinel-2 scenes.
The task included the following steps:
- checking the current status of farmlands in Ethiopia;
- generating the Sentinel-2 false-color mosaic layers from Google Earth Engine;
- mapping farmlands in OSM;
Current status of farmlands in Ethiopia
Before the task of mapping large commercial farms in Ethiopia, we used overpass-turbo to find all the farmlands that had previously been mapped in OSM (600 total). We then filtered this output to include only areas in the lowlands.
Sentinel-2 agricultural mosaic
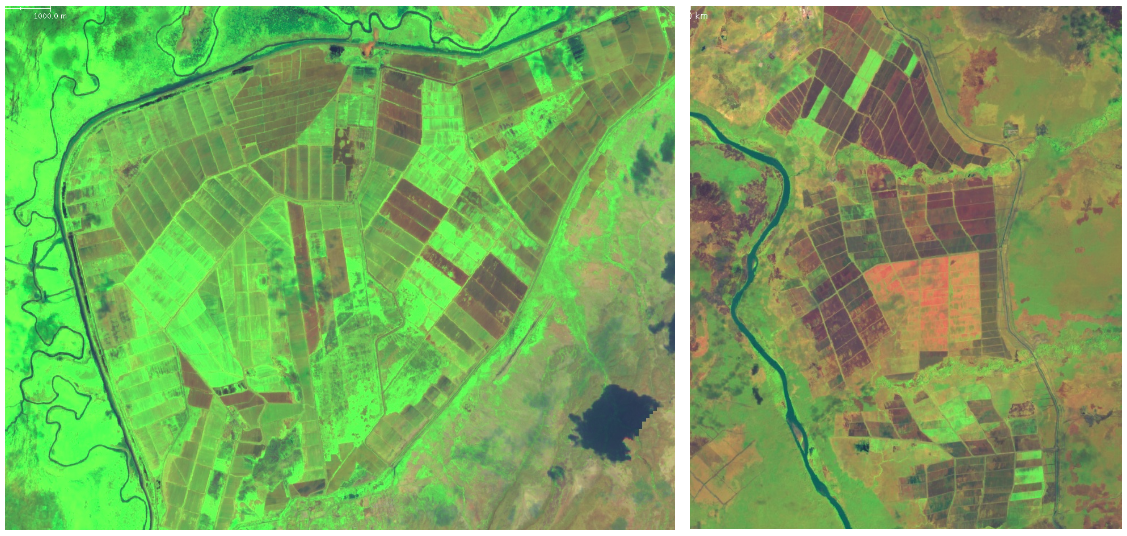
Sentinel-2 contains an innovative, high-resolution multispectral sensor with 13 spectral bands. The unique band combination and high spatial resolution represent an exciting opportunity to derive unique insights from EO data, particularly from vegetated and agricultural areas. The image below shows an example of the false-color composite generated using Sentinel-2 bands 11, 8 and 2.
To better capture the annual and seasonal dynamics inherent to agricultural systems, we generated composite scenes covering both the rainy and dry seasons, as described below:
Raining seasons:
- June to end of September (date: 2017/06/01 - 2017/09/30)
- June to end of September (date: 2016/06/01 - 2016/09/30)
- May to end of August(date: 2018/05/01 - 2018/08/04)
Dry season:
- November to mid-March (date:2017/11/01 - 2018/03/31)
Mapping large commercial farms in OSM
After generating the Sentinel-2 false-color composite scenes using Google Earth Engine, we imported the layers into JOSM for mapping using the image layer token.
During the mapping process, our mappers performed a visual inspection of all images intersecting the lowlands study area to identify all commercial farms. The following criteria were used:
- The agricultural plots have regular and identifiable patterns (e.g. roughly rectangular plots of approximately equal size), and have supporting infrastructure (e.g. service roads);
- The size of the farmland (the contiguous cluster of plots) is larger than 100ha; and
- The farmland can be seen both in high-resolution imagery (e.g. ESRI base layer), and 3-year Sentinel imagery layers.