UPDATE - Read all about the updated methodology in Mapping the Electric Grid.
Summary
Mapping power infrastructure - power lines and substations - is a problem that poses a unique set of challenges. Machine learning on satellite imagery is an approach that has the potential to facilitate this effort at scale, especially to map higher voltage infrastructure. This research effort assesses the feasibility of deep learning for grid detection in Non-Western areas like Sub Saharan Africa.
The main take-aways at this stage are:
- SkyNet is able to detect metal pylons and high voltage lines at very low resolutions using SAR data
- with SAR, the accuracy of the current model is about 75%, which we believe can be tuned to upward of 85%
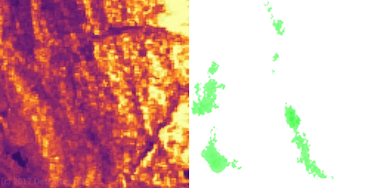
- a methodology relying solely on SAR does not work in mountainous areas
- using optical imagery sources, SkyNet is currently not able to detect power lines, even at high resolution. We have identified new approaches that could make optical imagery work
Background
SAR-C Images
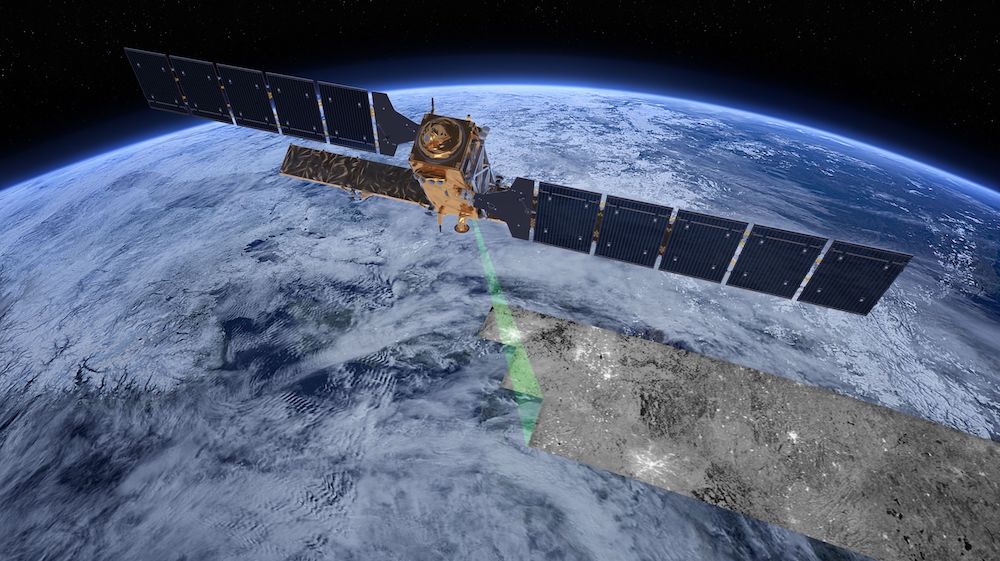
SAR-C images are captured in the same band of radio waves that wifi uses. In many respects, they are simpler to deal with than optical images - they don’t have clouds or shadows. They are also readily available under a public license. The ESA provides global SAR coverage with its Sentinel-1 constellation of satellites.
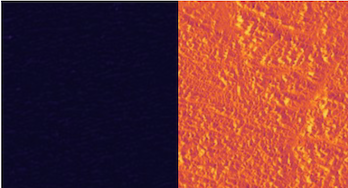
Usually, SAR images measure “surface roughness” (though they can also be used to measure a variety of other things, like terrain altitude). Very smooth surfaces, like desert, appear black, and rough surfaces like trees appear lighter. Somewhat rough surfaces like grass are grey.
SAR reflects off of artificial surfaces like concrete and metal, making it useful for estimating population density. This property is also uniquely useful for detecting the power grid.
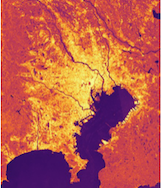
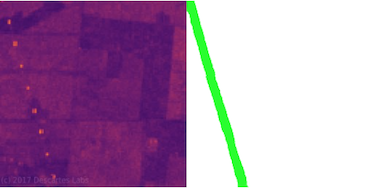
Since many high voltage power pylons are made of steel, their glare is visible even at very low resolutions. The power grid shows clearly as rows of dots even when it is invisible in optical images.
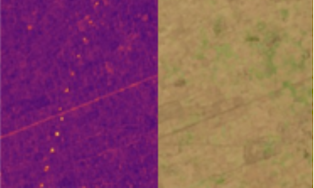
The images are of the same location
Machine Learning Using Satellite Images and Map Features
To detect whether a tiles has a power line in it, the computer uses a labeled dataset (tiles where it’s known for sure whether or not there’s a power line) to make a guess about whether there’s a power line in an unlabeled tile. We label the dataset using features from maps like OpenStreetMap or the Africa Grid Explorer.
To make valid predictions, the computer must have a lot (thousands) of accurate labeled tiles. This approach works really well for finding streets and buildings because there are typically lots of accurate OSM features to use. It’s more challenging to use for power grid detection because power lines are a lot less common.
Results
Optical Images
We quickly determined that we could not use one meter resolution images to identify power lines because they usually were not visible at that resolution. Due to the availability of imagery, this eliminated training in areas besides South Africa.
There, even with the best training data, power lines in low resolution optical images could not be detected. However, it is possible that this is not a fundamental limitation, but caused by our data processing. Our current data processing setup imposes several limitations which, if resolved, could make optical imagery effective at this task.
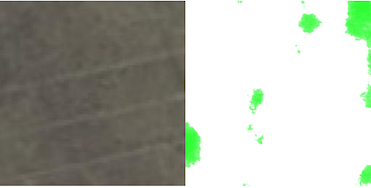
Currently, we use an approach called semantic segmentation, where we ask the computer to “draw” the lines on the image. However, zoomed this far in, the difference between the physical location of the power line and the location reported in Africa Grid Explorer is significant. The location of the line on the image therefore uncorrelated with the “correct” answer provided by the label. The program has no information it can use to make guesses.
We are working on switching to a different method, image classification, where the computer merely guesses whether or not the image container a power line. This has some disadvantages - it requires more labeled data and more data preprocessing. However, it should make it possible to use less accurate maps as labels.
Another contributing factor to the lack of success in using optical images is the image file format we use. Currently, all of the satellite images we use are downloaded as JPEGs, a format reduces file size by distorting sharp edges in images. Because we are trying to detect tiny objects with sharp edges (power lines and pylons), JPEG makes them less visible.

SAR Images
With SAR images, we were again limited to training in South Africa. The western African countries we investigated didn't have enough label data for power lines with metal pylons. It is possible that this is because there aren't many metal pylons in these countries, or it could simply be that they haven't been recorded as throughly as in South Africa.
There, about half of power lines could be accurately detected using SAR images. The success of the model was highly terrain dependent. Lines could not be detected in mountains, for example. Given that, in these situations, the lines aren’t visible to humans either, this seems to be a fundamental technical limitation of the imagery.
Other times, mountainous terrain gives false positives - the program guesses the existence of a power line where there isn’t one. This problem could be solved by preprocessing the data to remove tiles with mountains in them or by adding Landsat images as an additional input which would allow the program detect what sorts of terrain it is seeing and avoid false positives accordingly.
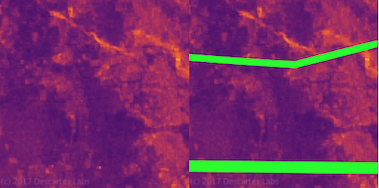
Currently, our program is about 75% accurate (for a given image, there is a 75% chance that the program correctly decided whether or not it has a power line in it). This can be tuned to favor completeness of up to 85% (i.e. 85% of images with power lines are identified as having power lines) or precision of up to 80% (i.e. 80% of images identified as having power lines actually have power lines in them).
Conclusions
Role of Machine Learning in Satellite Image Analysis
Currently, our model is not able to satisfactorily identify power lines from satellite images on its own. However, models like ours serve as a perfect compliment to current mapping techniques. Models like ours could be used to direct mappers on platforms like Mapswipe to areas that are most likely to have objects of interest, significantly increasing the amount of objects found with a given amount of work. OSM mappers could edit the guesses that these models make instead of tracing from scratch. To map Africa's high voltage power lines, we recommend using our model to prioritize images are tasked to human reviewers who look at each image and decide whether or not it actually contains power lines. If more detail is needed, the reviewers could trace the power lines. With more work, we hope our model will need less human input - it would trace the lines itself, the reviewer just makes small changes and approves the results.
Further Steps
Though the current solution to detecting high voltage power lines is workable, it could be significantly improved. Additionally, much of the research needed to needed to improve quality on high voltage lines could also be applied to low voltage lines.
The step that will most directly improve the current model would be adding more bands of imagery to the data. If we combined SAR data with optical or near-infrared images, the model could learn which areas are mountains, forests, and cities and avoid false positives. We could also implement a image classification model, which would give less granular but potentially more accurate information about where power lines are.
There are also a variety of smaller changes we could make that could significantly improve preformance. By varying things like how many images the machine learning algorithm views at once, how much weight it puts on individual wrong answers, and a host of other parameters, we could optimize our model. Given that our current parameters were already carefully tuned for optical images, there probably isn't a lot of work to be done here - but it could yield a few percentage points of improvement.
We could also do more work to make optical images a viable option, like switching to from JPEG to PNG images and creating a dataset with more accurate line locations, perhaps by by manually tracing over imagery. We could also create a dataset of pylon locations. These would probably necessary steps for detecting low voltage lines.
UPDATE - Read all about the updated methodology in Mapping the Electric Grid.