Introduction
Strategy
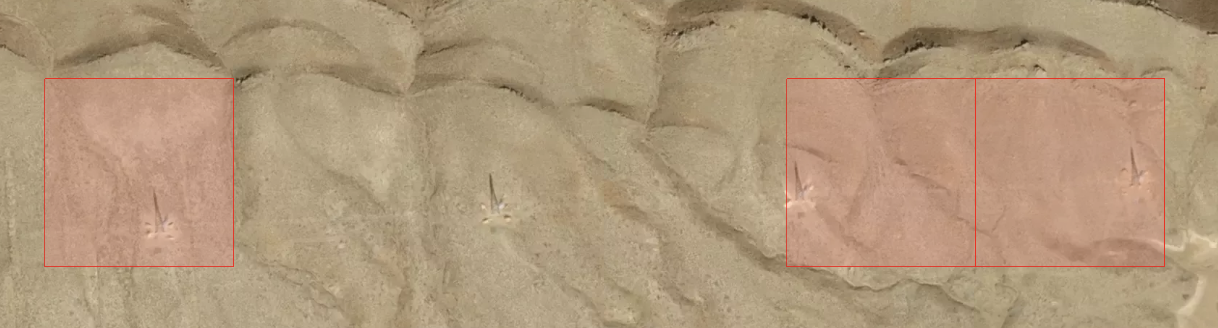
To generate a country-wide high voltage map, we hypothesized that a two part processing pipeline would work best. A machine learning model comprised the first component, which predicted the probability of a HV tower within individual zoom 18 satellite image tiles (or about 0.5 m/pixel). Its strength is processing speed -- when running on a modern GPU, the model is capable of processing hundreds of thousands of images per hour. We did not expect extremely high accuracy, however, so this first component acts as a first pass at detecting HV towers. The second component in the pipeline is made up of professional mappers. Humans are naturally more accurate at this task and can easily recognize HV towers against a wide range of backdrops from desert to dense forests. Therefore, they can accurately trace from tower to tower and note questionable features that need additional validation. Our goal was to combine these two components into an accurate but fast pipeline: The ML component acted to rapidly produce a prioritization map (Figures 3 and 4), which then guided our Data Team of human mappers to focus on high-value areas likely to contain a tower. The Data Team could then trace every component of the HV grid whether the ML model detected it or not. This ensured that their efforts were intelligently allocated instead of using a brute force approach of manually reviewing every meter of ground. It also meant that every edit added to OpenStreetMap was made by a human -- an important validation step to avoid incorrect changes to this community-driven map.
Some existing maps of the target countries did exist prior to this project, but in general they lacked quality. Most of the data available tracked a few lines across long distances but missed components of the grid or did not provide accurate locations. There were also some regional maps available, but these were not centralized in a single location. These maps each required extensive manual effort to produce; for this reason, it was not cost-effective to produce a map every with regularity or map multiple countries. Here, our three target countries included Pakistan (1,009,303 km2, 50 million zoom 18 tiles), Nigeria (927,886 km2, 40 million zoom 18 tiles), and Zambia (777,773 km2, 34 million zoom 18 tiles). Our aim was map HV infrastructure in these countries, but also to develop a reusable framework to reduce the time and cost associated with any future mapping efforts.