AI models
Results and conclusions
Country models: tile-based school classifier
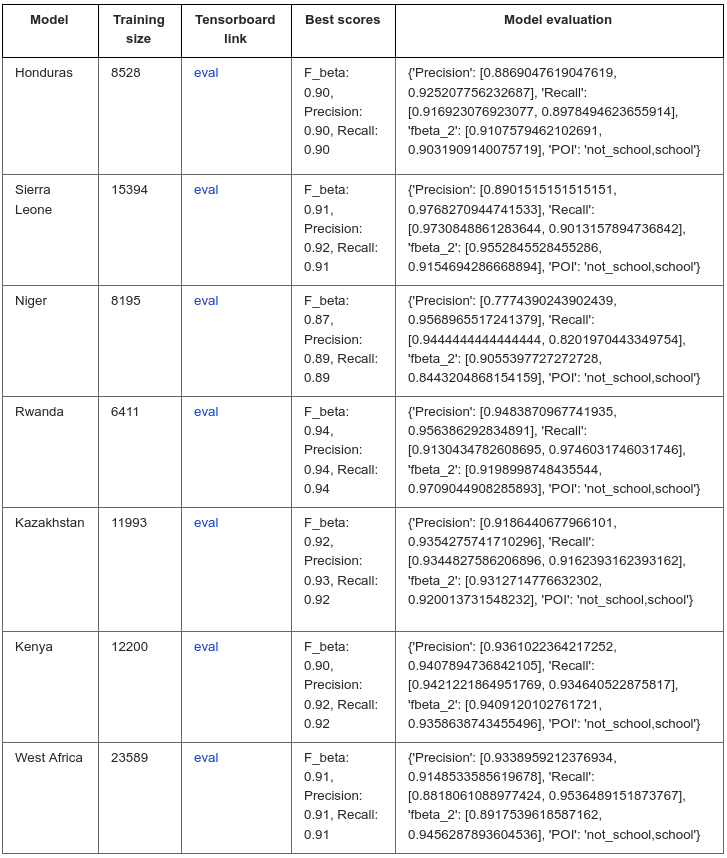
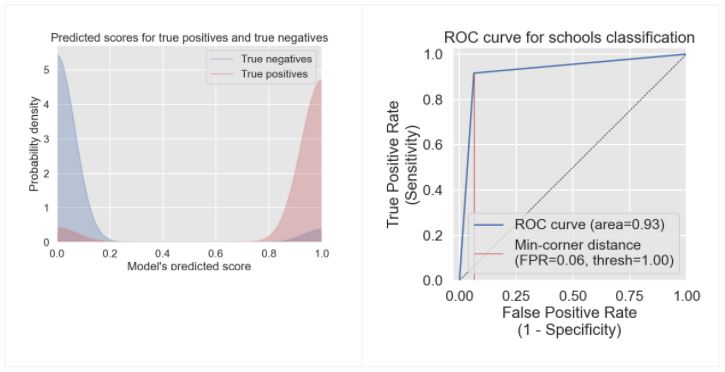
All country models performed really well with the validation dataset that all the model validation F1 scores were above 0.9 except Niger country model (0.87). The detailed model evaluation metrics, including precision, recall and F beta scores can be visualized through Table 4 Model evaluation column. You can click the ‘eval’ link to see our Tensorboard model training monitoring graph as well.
Despite their varied structure, many schools have identifiable overhead signatures that make them possible to detect in high-resolution imagery with deep learning techniques. Approximately 18,000 previously unmapped schools across 5 African countries, Kenya, Rwanda, Sierra Leone, Ghana, and Niger, were found in satellite imagery with a deep learning classification model. These 18,000 schools were validated by expert mappers and added to the map. We also added nearly 4,000 unmapped schools to Kazakhstan and Uzbekistan in central Asia, additional 1,097 schools in Honduras. In addition to finding previously unmapped schools, the models were able to identify already mapped schools up to ~ 80% depending on the country. To facilitate running model inference across over 71 million zoom 18 tiles of imagery our team relied on our open source tool ML-Enabler.
Kenya
The tile-based school classifier model for Kenya had made a randomly selected 6,000 “schools” and 6,200 “not-school” training dataset. The F1 score of the model is 0.9 over the validation dataset, which indicated it’s a good performance model.
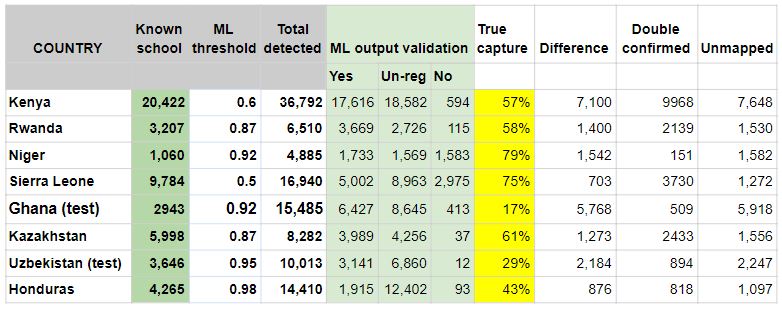
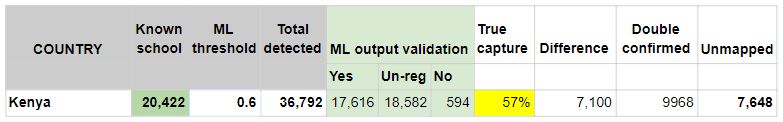
There were more than 20,000 known schools that were validated and confirmed by expert mappers in Kenya. When we used 0.6 ML confident score “ML threshold” there were ~37,000 schools detected, and ~18,000 of them have very distinguished school features, which were confirmed as “YES” schools by the human expert mappers. The ML model was able to capture ~60% of known schools in Kenya and find another 8,000 unmapped schools (Table 5).
Rwanda
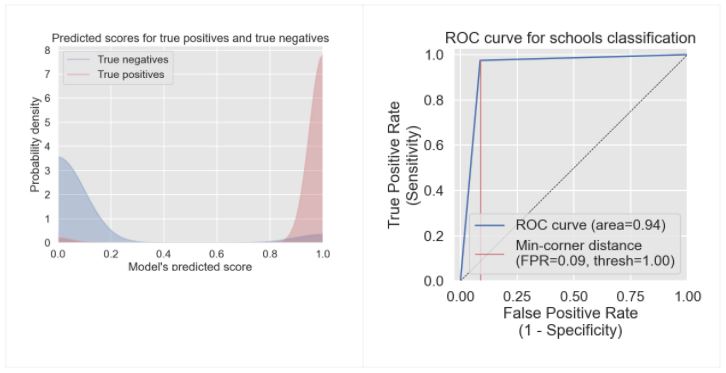
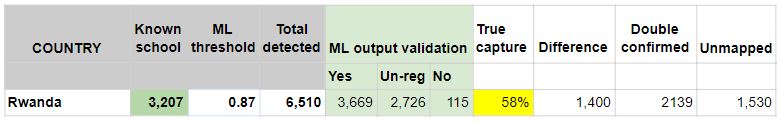
In the tile-based school classifier model for Rwanda, we selected all 3,200 positive and similar numbers of negative tiles in the training dataset. The F1 score of the model is 0.94 over the validation dataset, which indicated it’s a good performance model.
There were more than 3,200 known schools that were validated and confirmed by expert mappers in Rwanda. When we used the 0.87 ML confident score “ML threshold” there were ~6,500 schools detected, and ~3,700 of them have very distinguished school features. The ML model was able to detect ~60% of known schools in Rwanda and find more than 1,500 unmapped schools (Table 6).
Sierra Leone
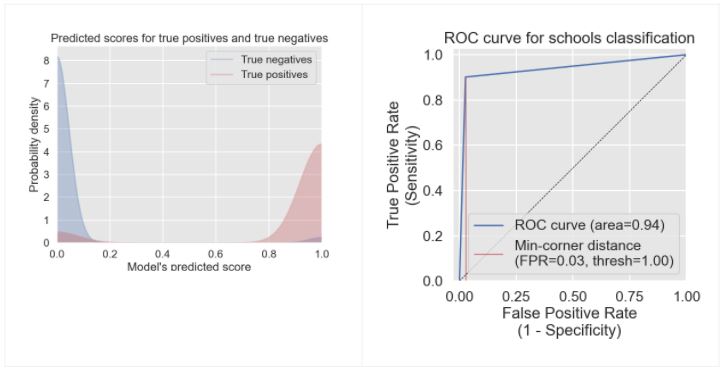
In the tile-based school classifier model for Sierra Leone, we selected all 9,800 “schools” and similar numbers of negative tiles of “not-school” in the training dataset. The F1 score of the model is 0.91 over the validation dataset, which indicated it’s a good performance model.
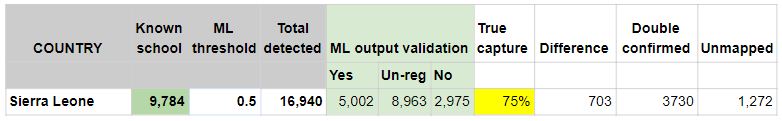
There were more than 9,800 known schools that were validated and confirmed by expert mappers in Sierra Leone. When we used the 0.5 ML confident score “ML threshold” there were ~17,000 schools detected, and ~5,000 of them have very distinguished school features. The ML model was able to detect ~75% of known schools and find another 1,300 unmapped schools. (Table 7).
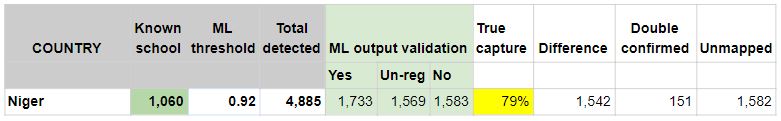
Niger
In the tile-based school classifier model for Niger, we selected all 1,600 positive and similar numbers of negative tiles in the training dataset. The F1 score of the model is 0.87 over the validation dataset, it’s the only country that achieved an F1 score under 0.9 but it indicated it’s a good performing model.
There were only 1,100 known schools that were validated and confirmed by expert mappers in Niger. When we used 0.92 ML confidence score “ML threshold” there were ~4,900 schools detected, and ~1,800 of them have very distinguished school features. The ML model was able to detect ~79% of known schools and find another 1,600 unmapped schools (Table 8). Note: Niger country model was trained with school data from Niger, Mali, Sudan, and Chad.
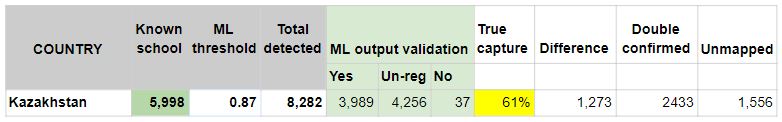
Kazakhstan
In the tile-based school classifier model for Kazakhstan, we selected all 6,000 positive and similar numbers of negative tiles in the training dataset. The F1 score of the model is 0.92 over the validation dataset, it indicated it’s a good performing model.
There were only 6,000 known schools that were validated and confirmed by expert mappers in Niger. When we used the 0.87 ML confidence score “ML threshold” there were ~8,300 schools detected, and ~4,000 of them have very distinguished school features. The ML model was able to detect ~61% of known schools and find another 1,560 unmapped schools (Table 9.).
Honduras
In the tile-based school classifier model for Niger, we selected all 4,300 positive and similar numbers of negative tiles in the training dataset. The F1 score of the model is 0.90 over the validation dataset, which indicated it’s a good performing model.
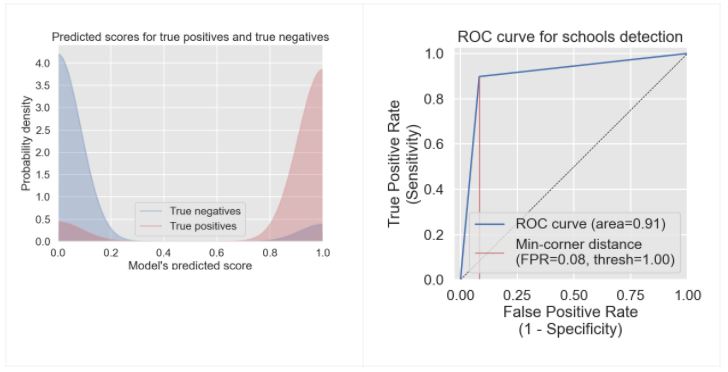
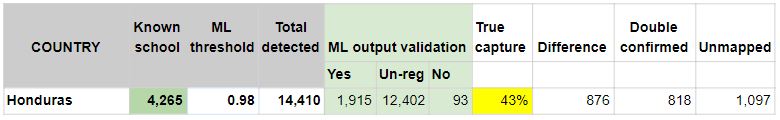
There were only 4,300 known schools that were validated and confirmed by expert mappers in Honduras. When we used 0.98 ML confidence score “ML threshold” there were ~14,400 schools detected, and ~1,900of them have very distinguished school features. The ML model was able to detect only ~42 % of known schools and find another 1,100 unmapped schools (Table 10).
Ghana (Test country)
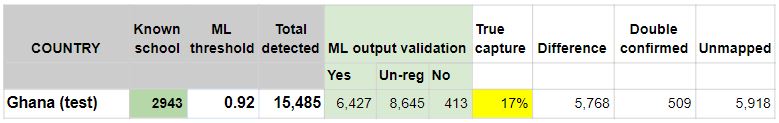
Ghana is one of two countries as test countries besides Uzbekistan. It meant we did not build a tile-based school classifier country model for Ghana. A test country means we used a trained model from elsewhere to apply the model inference over Ghana’s dataset. Therefore, the Known schools in this context are schools we extracted from OSM that without human expert mappers validation at all. We used the West African model (trained with school & not-school data from Sierra Leone and Niger) to run the model inference over supertiles of Ghana. At ML confidence score of 0.92, we were able to detect 15,500 schools, after the expert mappers validation more than 6,400 schools were selected. There is only 17% of true capture (To intersect the double confirmed schools, which means ML validated schools by human expert mappers matched Known schools), that indicated schools in Ghana are way under mapped, and that’s the reason we were able to discover nearly 6,000 unmapped schools.
Uzbekistan (Test country)
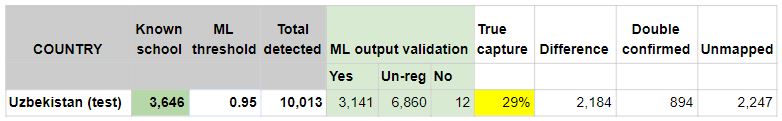
Uzbekistan is one of two countries as test countries besides Ghana. It meant we did not build a tile-based school classifier country model for Uzbekistan. A test country means we used a trained model from elsewhere to apply the model inference over the Uzbekistan dataset. Therefore, the Known schools in this context are schools we extracted from OSM that without human expert mappers validation at all. We used the Kazakhstan country model (trained with school & not-school data Kazakhstan) to run the model inference over supertiles of Uzbekistan. At ML confidence score of 0.95, we were able to detect more than 10,010 schools, after the expert mappers validation more than 3,100 schools were mapped. There is only 29% of true capture (To intersect the double confirmed schools, which means ML validated schools by human expert mappers matched Known schools), that indicated schools in Uzbekistan is way under mapped, and that’s the reason we were able to discover more than 2,200 unmapped schools.
Regional and global models performance in Kenya
In this section, we meant to compare the model performances between the country, regional and global models. In this context, the country model is trained with the country-specific schools and not-schools data, the regional model is trained with countries datasets that are geophysically close to each other. For instance, the East African regional model is trained with Kenya and Rwanda datasets, and the West African regional model was trained with Niger, Sudan, Mali, Chad, and Sierra Leone datasets. It’s self-explanatory that the global model was trained with all-country datasets.
Kenya is the only country that has over 20,000 known schools that have been validated by expert mappers. Only 6,000 schools in Kenya were randomly selected to train the Kenya country model. It means there are more than 14,000 known schools left over as “test data” that were never exposed to the model. Therefore, Kenya is the perfect country to answer questions like:
- How do regional and country models perform differently?
- Is that necessarily true to build country-specific models or can we rely on only the regional model that’s generalized well across countries?
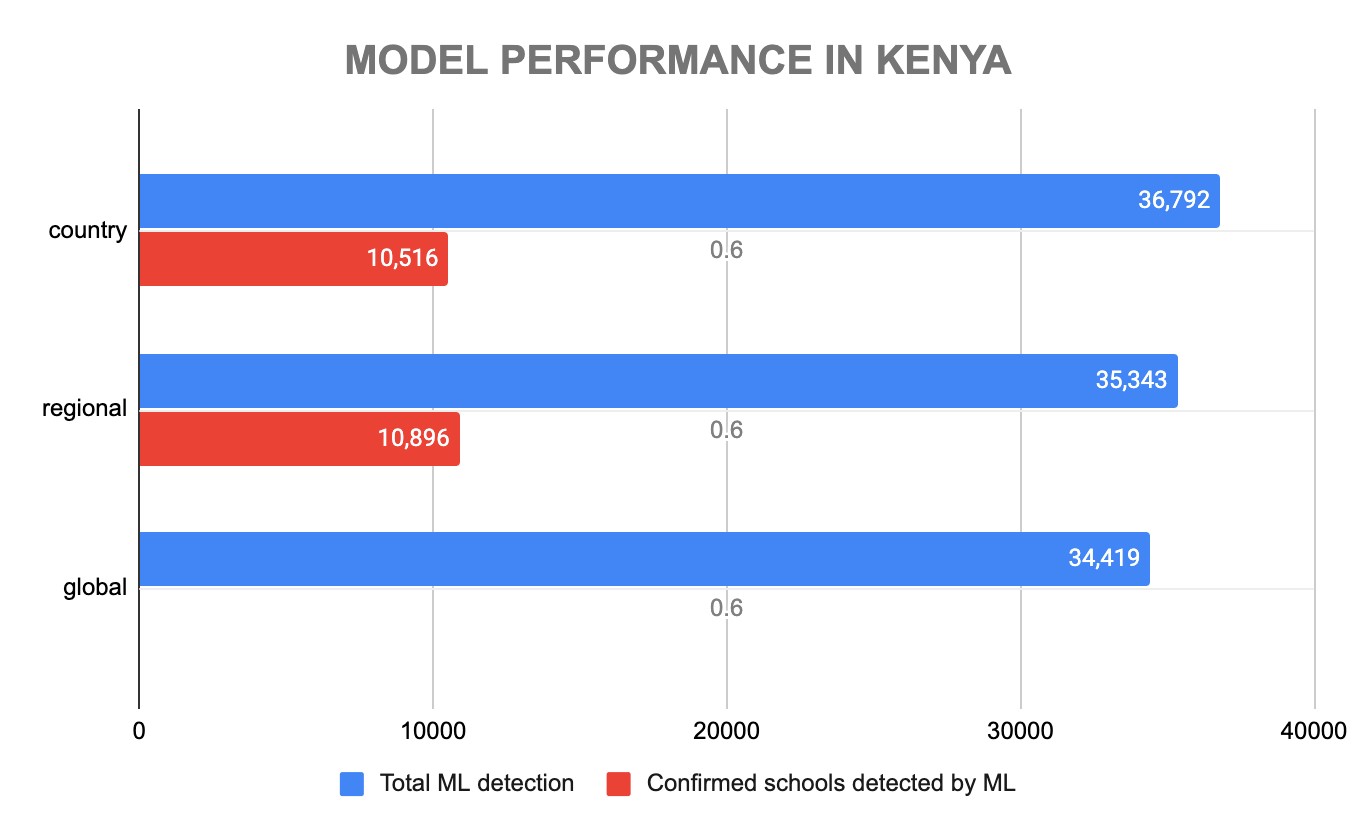
By plotting the results from Kenya model inferences with the Kenya country, East African regional and global model, we found:
- The regional model outperformed the country model in that it produced fewer ML-detected schools (Figure 13 - blue bar), which means fewer false positives. It was able to detect more schools (the red bar) that fell under unknown schools.
- Both country and regional model perform very well despite the models were only exposed to only a quarter of the available known schools in Kenya;
- In the future, either model transfer-learning or fine-tuning, to train a regional model instead of developing country-specific models.
Direct school detection in Kenya
Direct school detection model
We started a direct school detection model over Kenya the initial result looks promising. Model training will take about another 30 hours over the weekend until it reaches 50000 steps. Currently, the screenshot shows the result of 19,581 steps as fellows (Figure 14). The image on the left is the model prediction over the validation dataset, and on the right is the ground truth. The model inference with the trained direct school detection in Kenya. The speed of the ML inference is 23.4 tiles per second or 2,906,997 supertiles over 34.5 hours. We still use ML-Enabler to perform our model inference. Compared to the tile-direct school classifier, the direct school detention model in Kenya is less performing, that caused by object detection is less accurate and slower to train and inference than image classification models in general.
ML-Enabler35 is a machine learning integration tool in partnership between Development Seed and the Humanitarian OpenStreetMap Team36. ML Enabler is a registry for machine learning models in OpenStreetMap and aims to provide an API for tools like Tasking Manager37 to directly query predictions.
Direct school detection model result validation
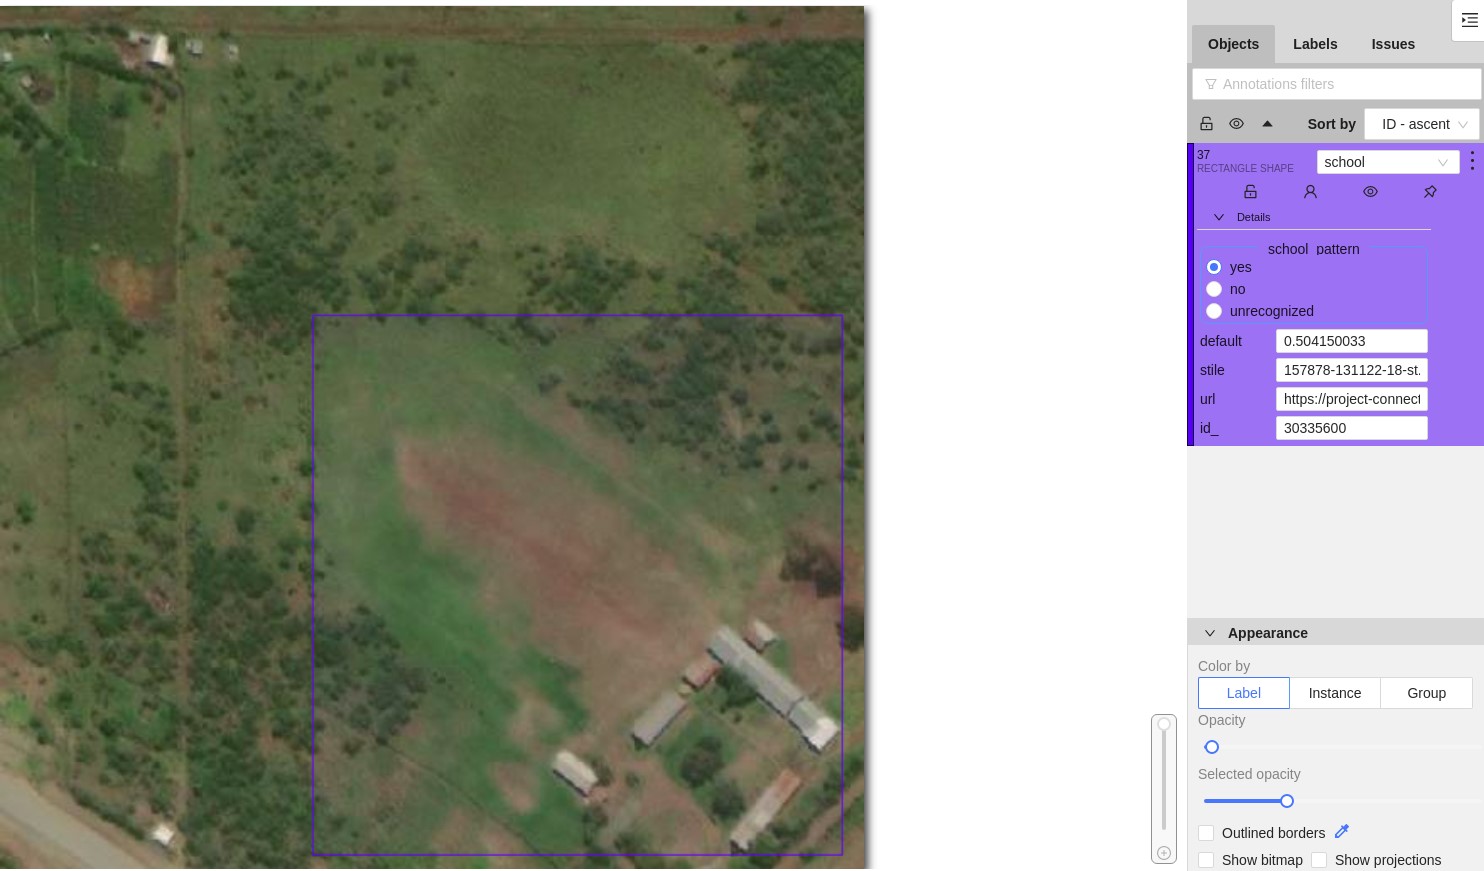
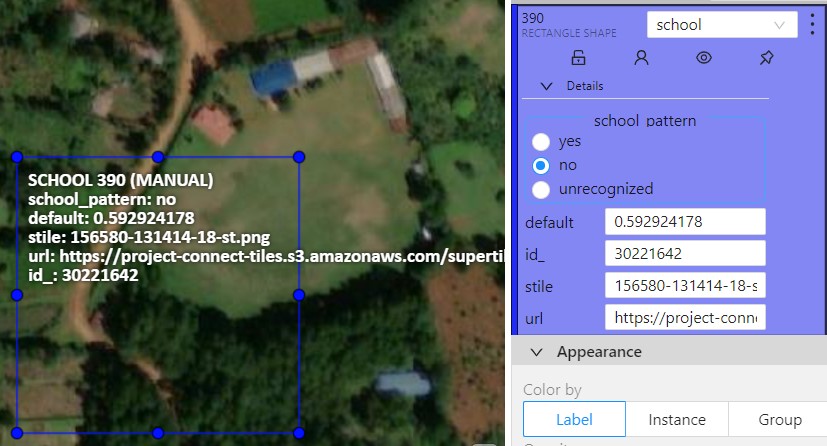
DevSeed Data Team expert mappers tagged the detected school from the model inference as appropriate as: “Yes”, “No” or “Unrecognized” like we did for tile-based school classifier models. The expert mappers also adjust the bbox to capture the school building complex when the detection is “Yes”. The model inference result validation was at the speed of 431 schools per minute.
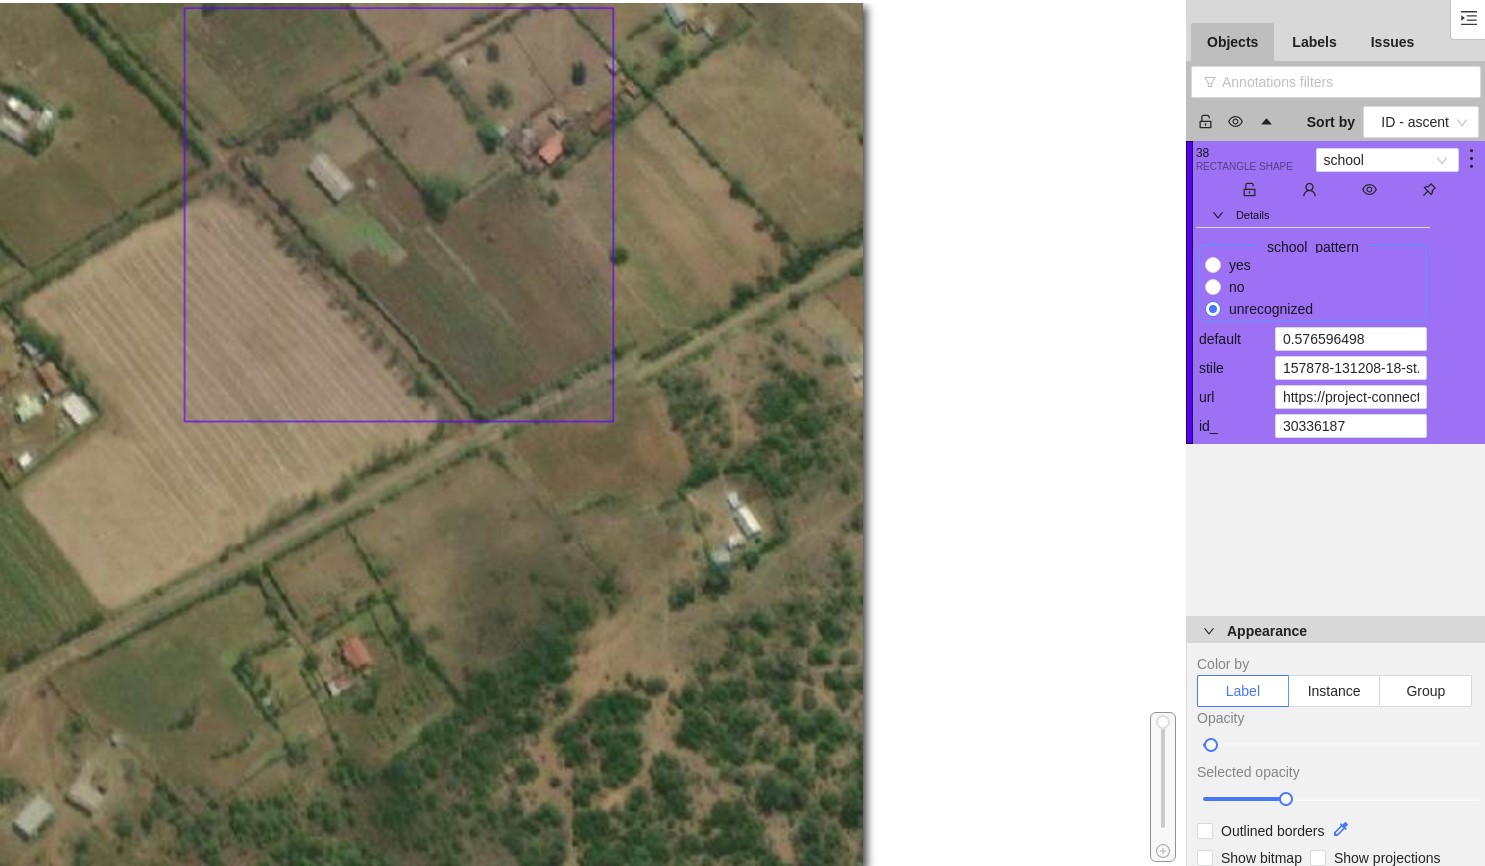
- Bbox with a school detected.- We considered this following case as “school pattern = yes” only if part of the school buildings were detected, also we have to adjust the bbox to cover the whole schools boundary.
- Bbox with an unrecognized school.- We tag this case as “school pattern = unrecognized” only if in the bbox there are buildings but we can not recognize school patterns there.
- Bbox without any building detected.- We tagged this as “school pattern = no” in the detections where there are not any buildings.
__________________________________
35 "On-demand machine learning predictions for mapping tools ...." 5 Aug. 2020, https://developmentseed.org/blog/2020-08-05-on-demand-machine-learning-predictions-for-mapping-tools/. Accessed 17 Feb. 2021.36 "Humanitarian OpenStreetMap Team." https://www.hotosm.org/. Accessed 17 Feb. 2021.
37 "HOT Tasking Manager." https://tasks.hotosm.org/. Accessed 17 Feb. 2021.