Training data
Training data generation and analysis
Training data generations were done for both model developments, tile-based image classification, and direct school detection. A tile-based school classifier is a binary image classification based on Xception6 pre-trained model from ImageNet7. The direct school detection model is an Object Detection model that we adapted from TensorFlow Object Detection API8, specifically, it’s a pre-trained SSD MobileNet ResNet1019 Coco model.
Tile-based School Classifier
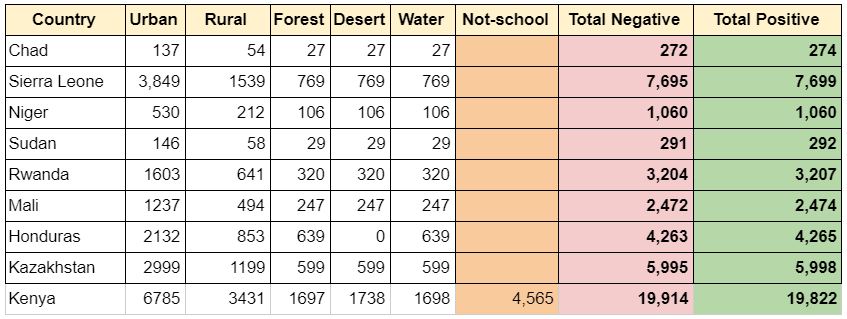
The tile-based school classifier is a binary image classification based on Xception10 pre-trained model from ImageNet11. Two categories of datasets, ‘school’ and ‘not-school’, were generated as the training dataset for the machine learning model. The category ‘school’ tiles were downloaded based on the geolocation of schools that were tagged as “YES” after the DevSeed Data Team’s training data validation (Table 1). Though, the category of “not-school” is more diverse than “school”, because it includes the categories except schools, e.g. forest, desert, critical infrastructures (places of worships, government office, hospitals, market places, factory), residential buildings, oceans, other water bodies etc. To enrich the data sets for ‘not-school’, we queried all the categories mentioned above from OSM using OSM Map Features12.
Supertile Generation
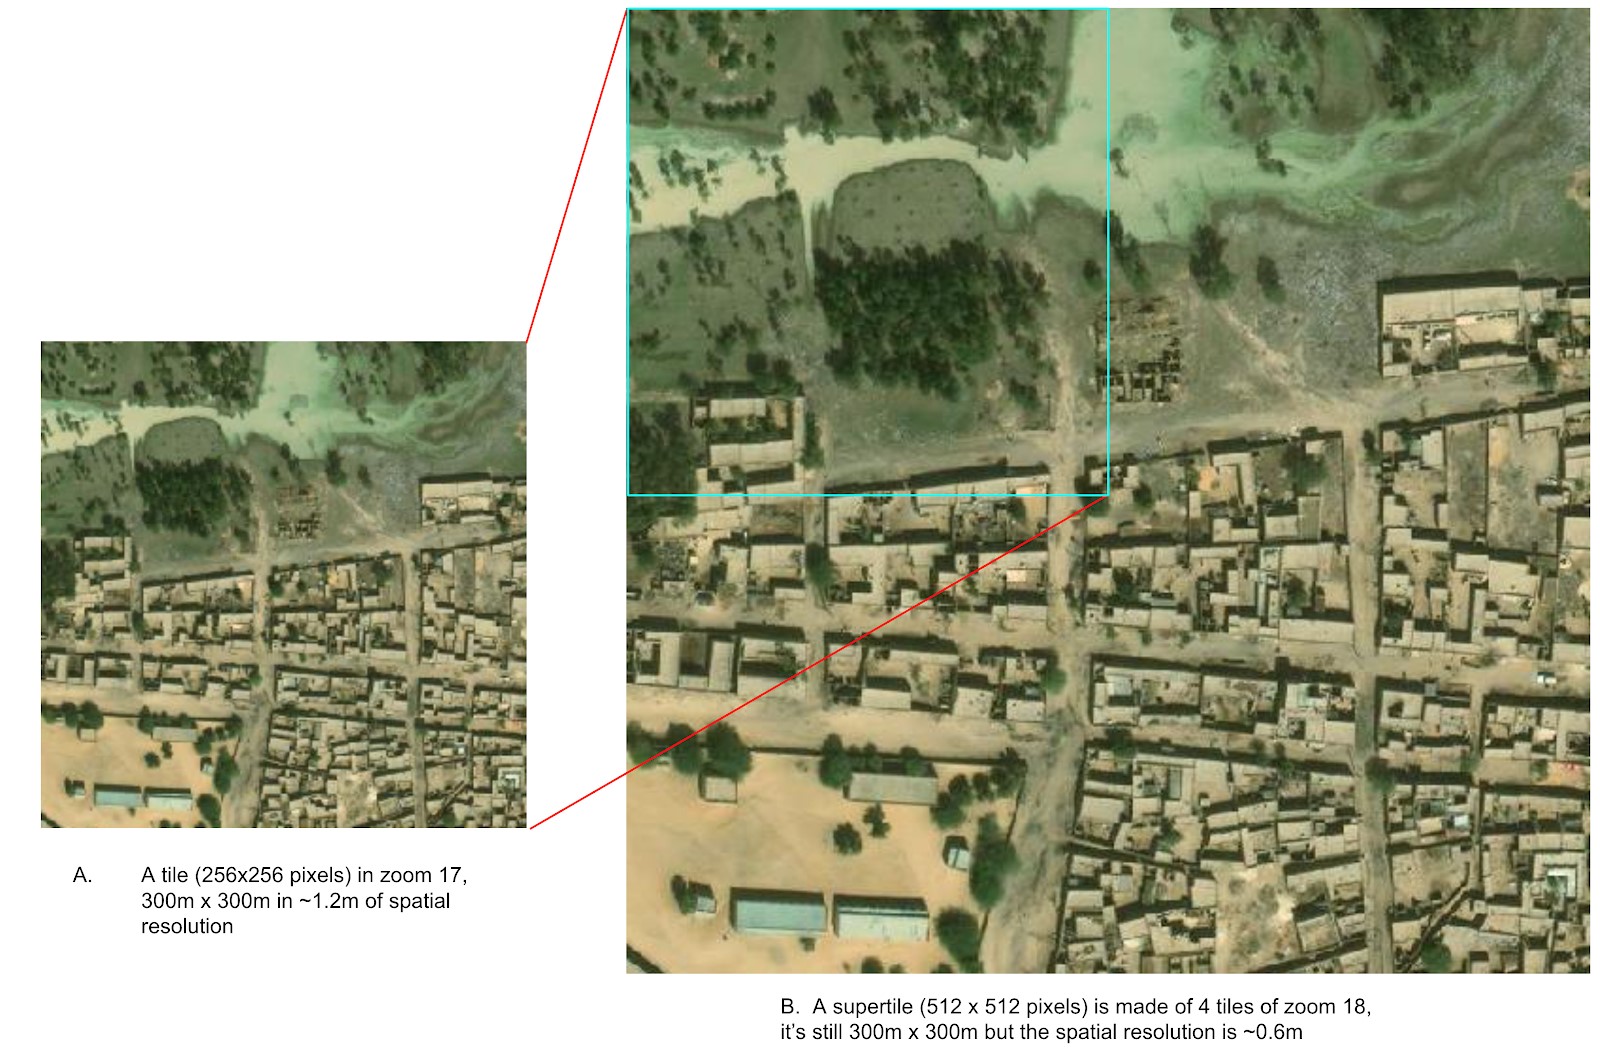
The images that went to train tile-based school classifier models were image chips/tiles of OSM slippy map tiles13. In the past school mapping task in Colombia, we found that when a tile is in Zoom 1714, the classification model performed the best. The tiles in Zoom 17 are about 300m x 300m and in spatial resolution of 1.2m/pixel. In this phase of work, we maximized the spatial resolution of the satellite image and instead of using Zoom 17, we created a supertile that made up 4 zoom 18 tiles. A supertile still represents 300m x 300m, but by using zoom 18, we actually have satellite image tiles in spatial resolution of 0.6m instead of 1.2m. Therefore, the school classifier models can learn more image features from high-resolution super tiles.
Geo-diversity Analysis
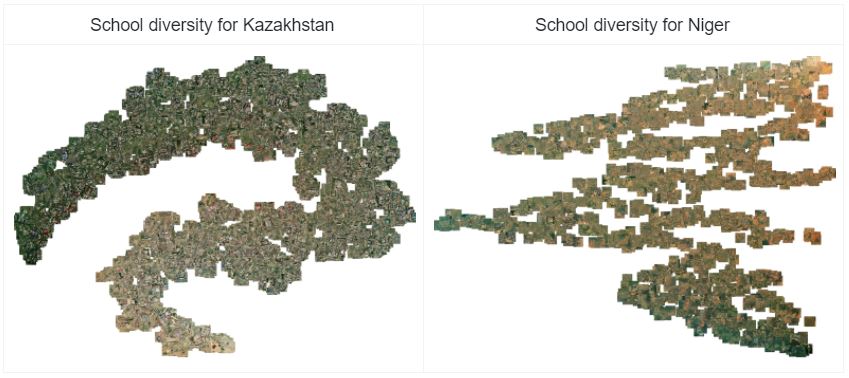
Geodiversity represents the diversity of our landscapes that can be captured by satellite instruments. When it comes to optical images, they are a set of image features that includes mountains, vegetation distribution, hurricanes, smoke patterns. Then we can compare, by image similarity metrics, for instance, t-SNE15, our data set to the area we want to generalize over. This will help evaluate whether our training images for machine learning models are a representative sample of our desired deployment region.
In this context, ‘geodiversity’ of school and not-school for the six countries we are interested in developing models. The supertiles can be plotted to showcase the distribution of the data classes from lush-like to desert-like (Figure 4). This is done simply by reducing the image to a single feature vector which is the average RGB value. These vectors are passed to the t-SNE algorithm which is trying to map data to 2 dimensions (in this case) by computing ‘similarity scores’ to cluster the data, creating a good visual approximation of the original dimension of the data.
Training Data Generation
To assess the model performance fairly, our training dataset of two categories, school, and not-school tiles, are then split into 70:20:10 ratio as train, validation, and test datasets. These three sets of data were generated as TFRecords. TFrecords is a data format that stores a sequence of binary records for Tensorflow to read image and label data efficiently during the model training16. The randomly selected 70% of tiles went to train the model, the remaining 20% was used to validate the model. The training set was seen and used by the model intensively to train the school classifier, and the validation set is occasionally seen and used to fine-tune the classifier. However, the last 10% of the test dataset was not seen by the model, and it acts as the golden standard dataset to evaluate the model performance (Figure 2.)
Training Data Generation for the Direct School Detection
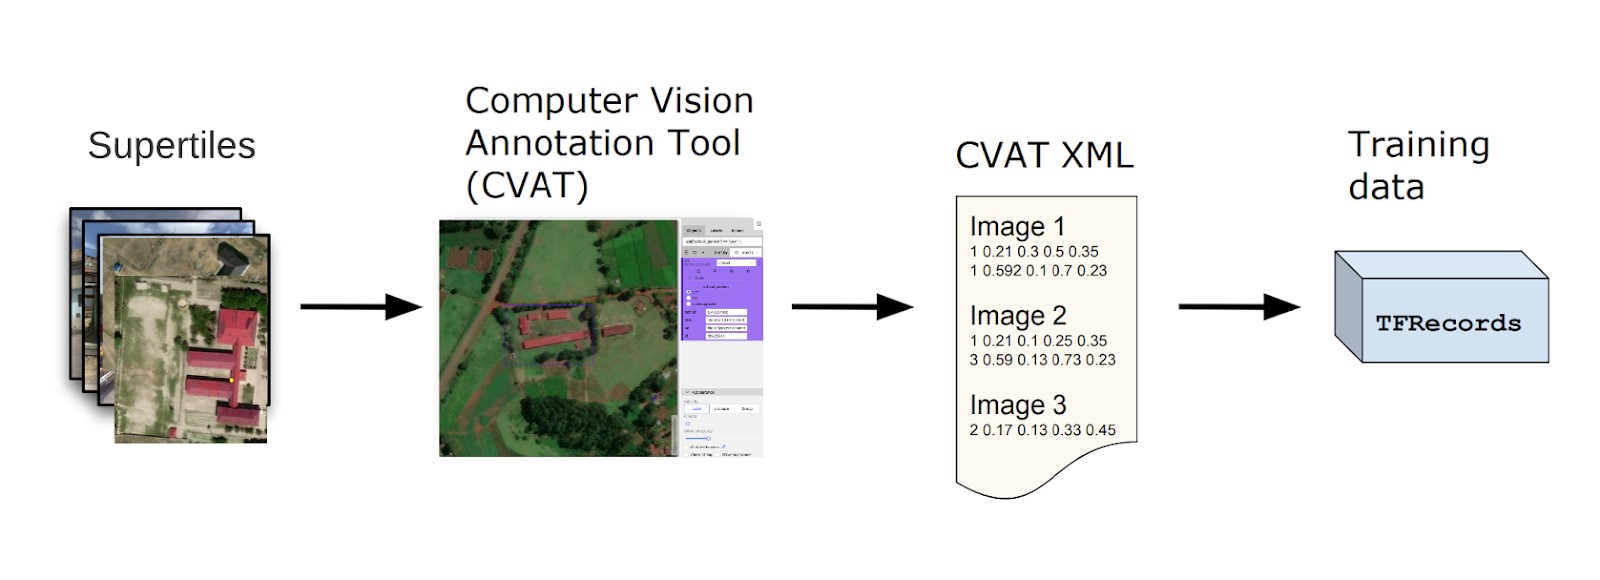
The direct school detection model is an Object Detection model that we adapted from TensorFlow Object Detection API17, specifically, we used a pre-trained SSD MobileNet ResNet10118 Coco model. The training dataset was created by drawing bounding boxes around the school building complex. Computer Vision Annotation Tool (CVAT)19 was used to draw bounding boxes of schools. XML files were then exported from CVAT, and TFRecords were generated for model development of direct school detection. We only developed a country model - Kenya direct school detection during the project.
__________________________________
6 "Xception: Deep Learning with Depthwise Separable Convolutions." 7 Oct. 2016, https://arxiv.org/abs/1610.02357. Accessed 17 Feb. 2021.7 "ImageNet." http://www.image-net.org/. Accessed 17 Feb. 2021.
8 "Object Detection | TensorFlow Hub." https://www.tensorflow.org/hub/tutorials/object_detection. Accessed 17 Feb. 2021.
9 "models/tf2_detection_zoo.md at master · tensorflow/models · GitHub." 9 Sep. 2020, https://github.com/tensorflow/models/blob/master/research/object_detection/g3doc/tf2_detection_zoo.md. Accessed 17 Feb. 2021.
10 "Xception: Deep Learning with Depthwise Separable Convolutions." 7 Oct. 2016, https://arxiv.org/abs/1610.02357. Accessed 17 Feb. 2021.
11 "ImageNet." http://www.image-net.org/. Accessed 17 Feb. 2021.
12 "Map features - OpenStreetMap Wiki." https://wiki.openstreetmap.org/wiki/Map_features. Accessed 17 Feb. 2021.
13 "Slippy map tilenames - OpenStreetMap Wiki." 5 Jan. 2021, https://wiki.openstreetmap.org/wiki/Slippy_map_tilenames. Accessed 17 Feb. 2021.
14 "Zoom levels - OpenStreetMap Wiki." 27 Aug. 2019, https://wiki.openstreetmap.org/wiki/Zoom_levels. Accessed 17 Feb. 2021.
15 "t-SNE – Laurens van der Maaten." https://lvdmaaten.github.io/tsne/. Accessed 17 Feb. 2021.
16 "TFRecord and tf.train.Example | TensorFlow Core." https://www.tensorflow.org/tutorials/load_data/tfrecord. Accessed 17 Feb. 2021.
17 "Object Detection | TensorFlow Hub." https://www.tensorflow.org/hub/tutorials/object_detection. Accessed 17 Feb. 2021.
18 "models/tf2_detection_zoo.md at master · tensorflow/models · GitHub." 9 Sep. 2020, https://github.com/tensorflow/models/blob/master/research/object_detection/g3doc/tf2_detection_zoo.md. Accessed 17 Feb. 2021.
19 "openvinotoolkit/cvat: Powerful and efficient Computer ... - GitHub." https://github.com/openvinotoolkit/cvat. Accessed 17 Feb. 2021.