Results
Bonaberi-Douala IZ
Doualla is the largest city in cameroon, and its main economic hub, even though a large percentage of its inhabitants still live below the poverty line, and is a growing problem due to urbanization.
The Doualla region’s population stands at over 3 million (compared to 2.1million om 2055, approximately 11% of Cameroon’s total population, and about 20% of the urban population). The city’s uncontrolled growth rate is a significant concern, and challenges in supporting it’s ~5% annual growth rate (in comparison to the national average of 2.3%).
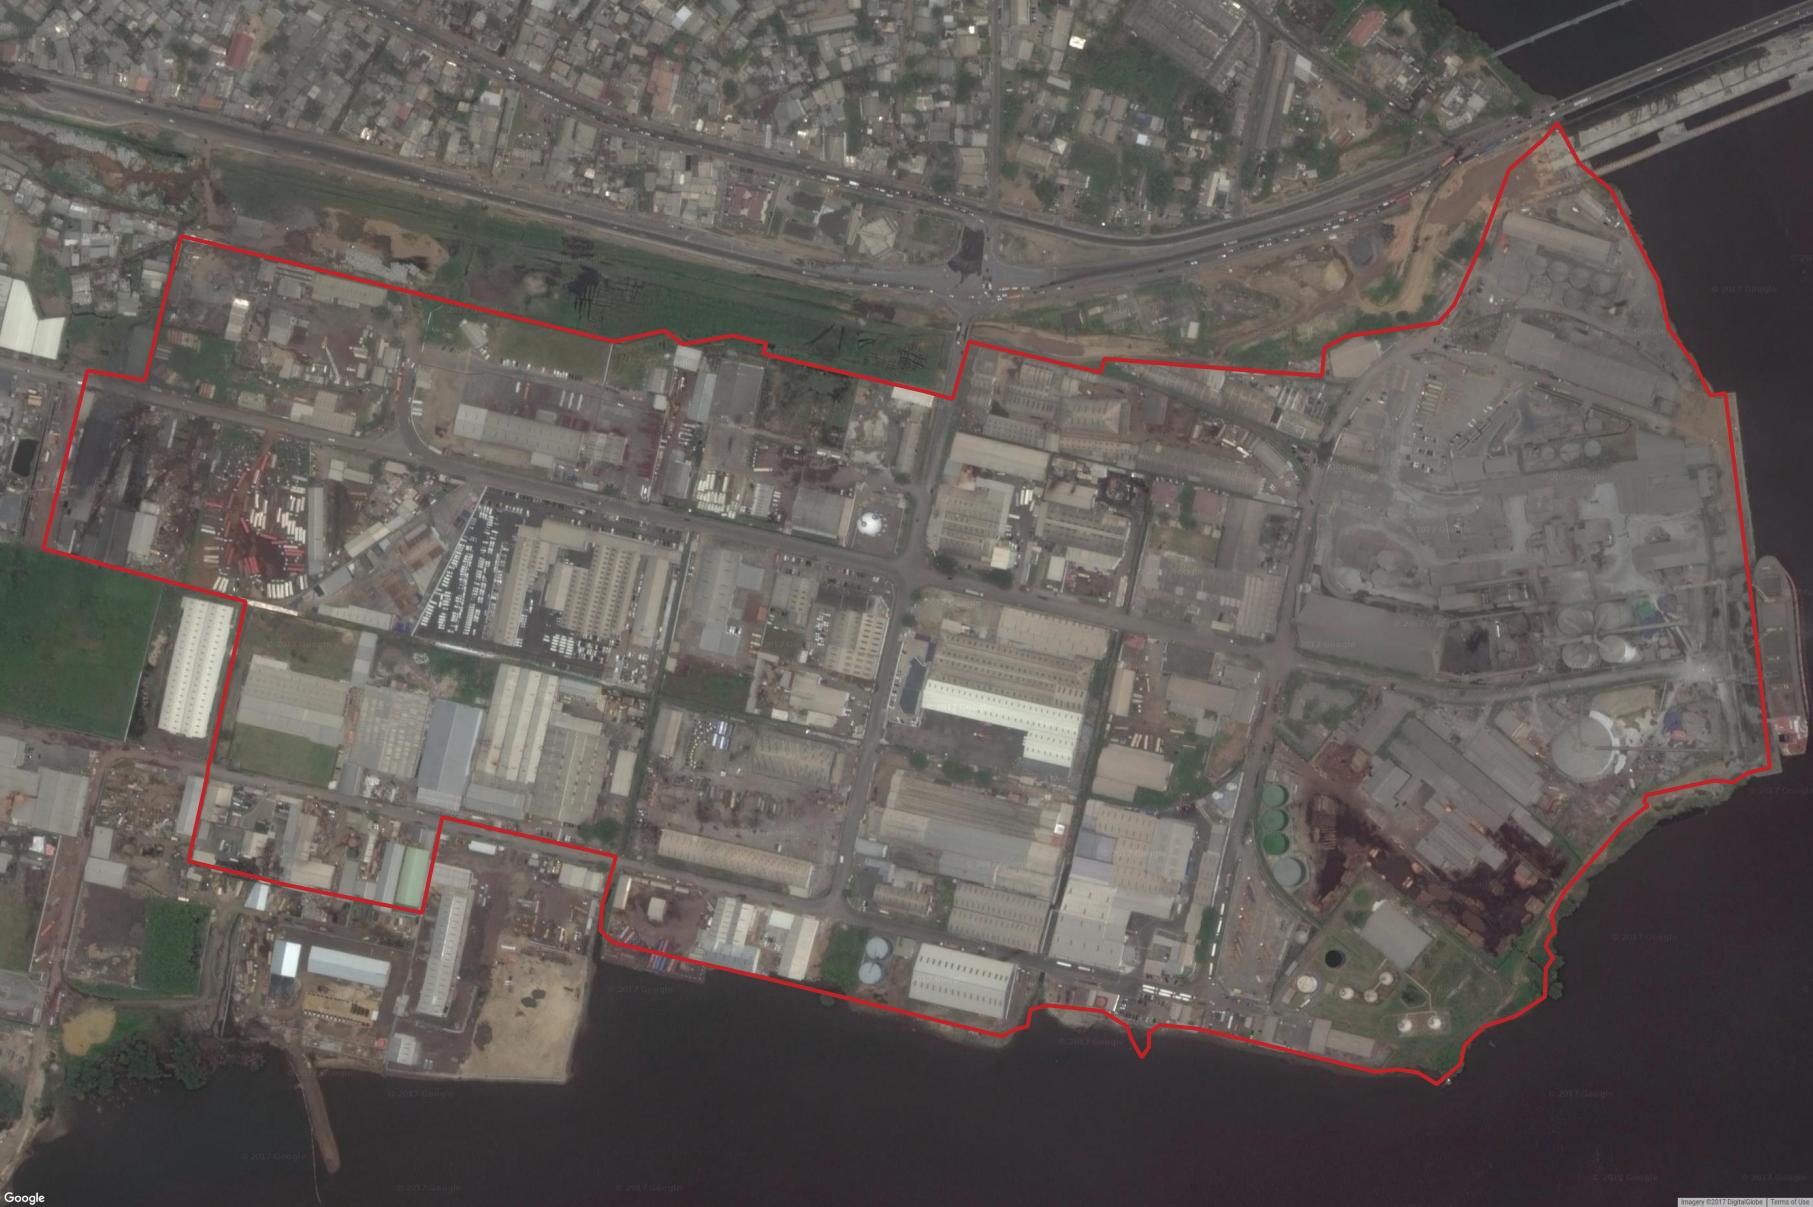
The Bonaberi-Douala industrial estate is situated to the west of the city across the bonaberi bridge, and hence has direct access to Bonaberi port, and indirectly Doula port. As such its infrastructural links are extremely well established, reflecting the extremely mature status of the industrial zone.
The site is completely saturated, and have recently been claimed to be too overcrowded: “Bassa and Bonaberi are suffocating” - indeed these two zones host 47% of the cities 340 firms. The region now has natural gas links (2014). Industry covers a wide range of activities, and in particular cement.
- Size analyzed: 84 hectares
- Established: 1977
- Phase: Operational
Analysis
It is extremely challenging to assess the economic impact of the Bonaberi industrial zone, which is not only extremely mature in age, but was originally mandated with relieving the pressure on the Bassa IZ also attached to the city. Distinguishing its overall economic impact on the region distinct from that of Bassa is nigh on impossible, and the two ought be considered in dual context.
Only extremely longitudinal EO imagery are likely appropriate as a basis for analysis of this site, examining the years between 1977-1987, applying road analysis, land use classification, energy usage prediction and pm2.5 analysis. During Phase I such imagery was not available.
However, it is widely accepted that issues of severe poverty in the region remain, and here it is clear that job creation in the industrial zones has either been insufficient or neglected the local population (indeed there is some opinion that local inhabitants are under greater financial pressures than those in rural cameroon). Assessment of the extent of these difficulties as required if we are to evidence that the industrial zone has not had the desired impact on the local population.
Recent analysis of EO imagery will however verify the current state of play in the region. Development of the zone has resulted in surrounding urbanization, and Bonaberi suffers from uncontrolled demographic growth and much unplanned settlement building - indeed extensive slums have development to the west of the site. This has resulted in increased flood risks and serious waste disposal challenges, providing deleterious effect on socio-demographic development. A land-use classification analysis would be of particular use in this area, with analysis of micro-indicators extractable from indicating the levels of unemployment in the area.
Further in 2015 the zone experience several months of power outages due to recurrent network failures. These may be analyzable via night light type analysis.
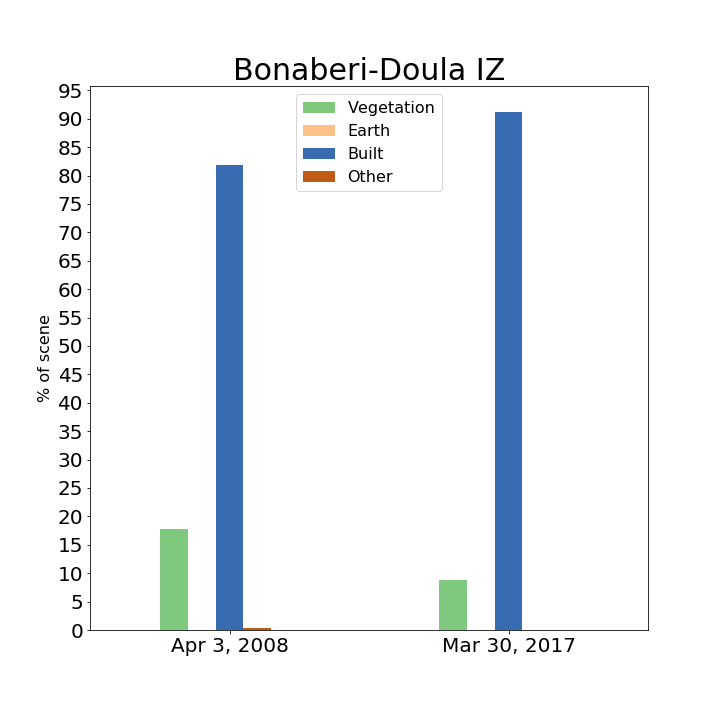
Land Classification
Two Worldview images were used, 9 years apart. However, Bonaberi-Douala is a well established 40 year old zone. There is no earth, although 9 years ago there were some patches of vegetation, these have since been built on.
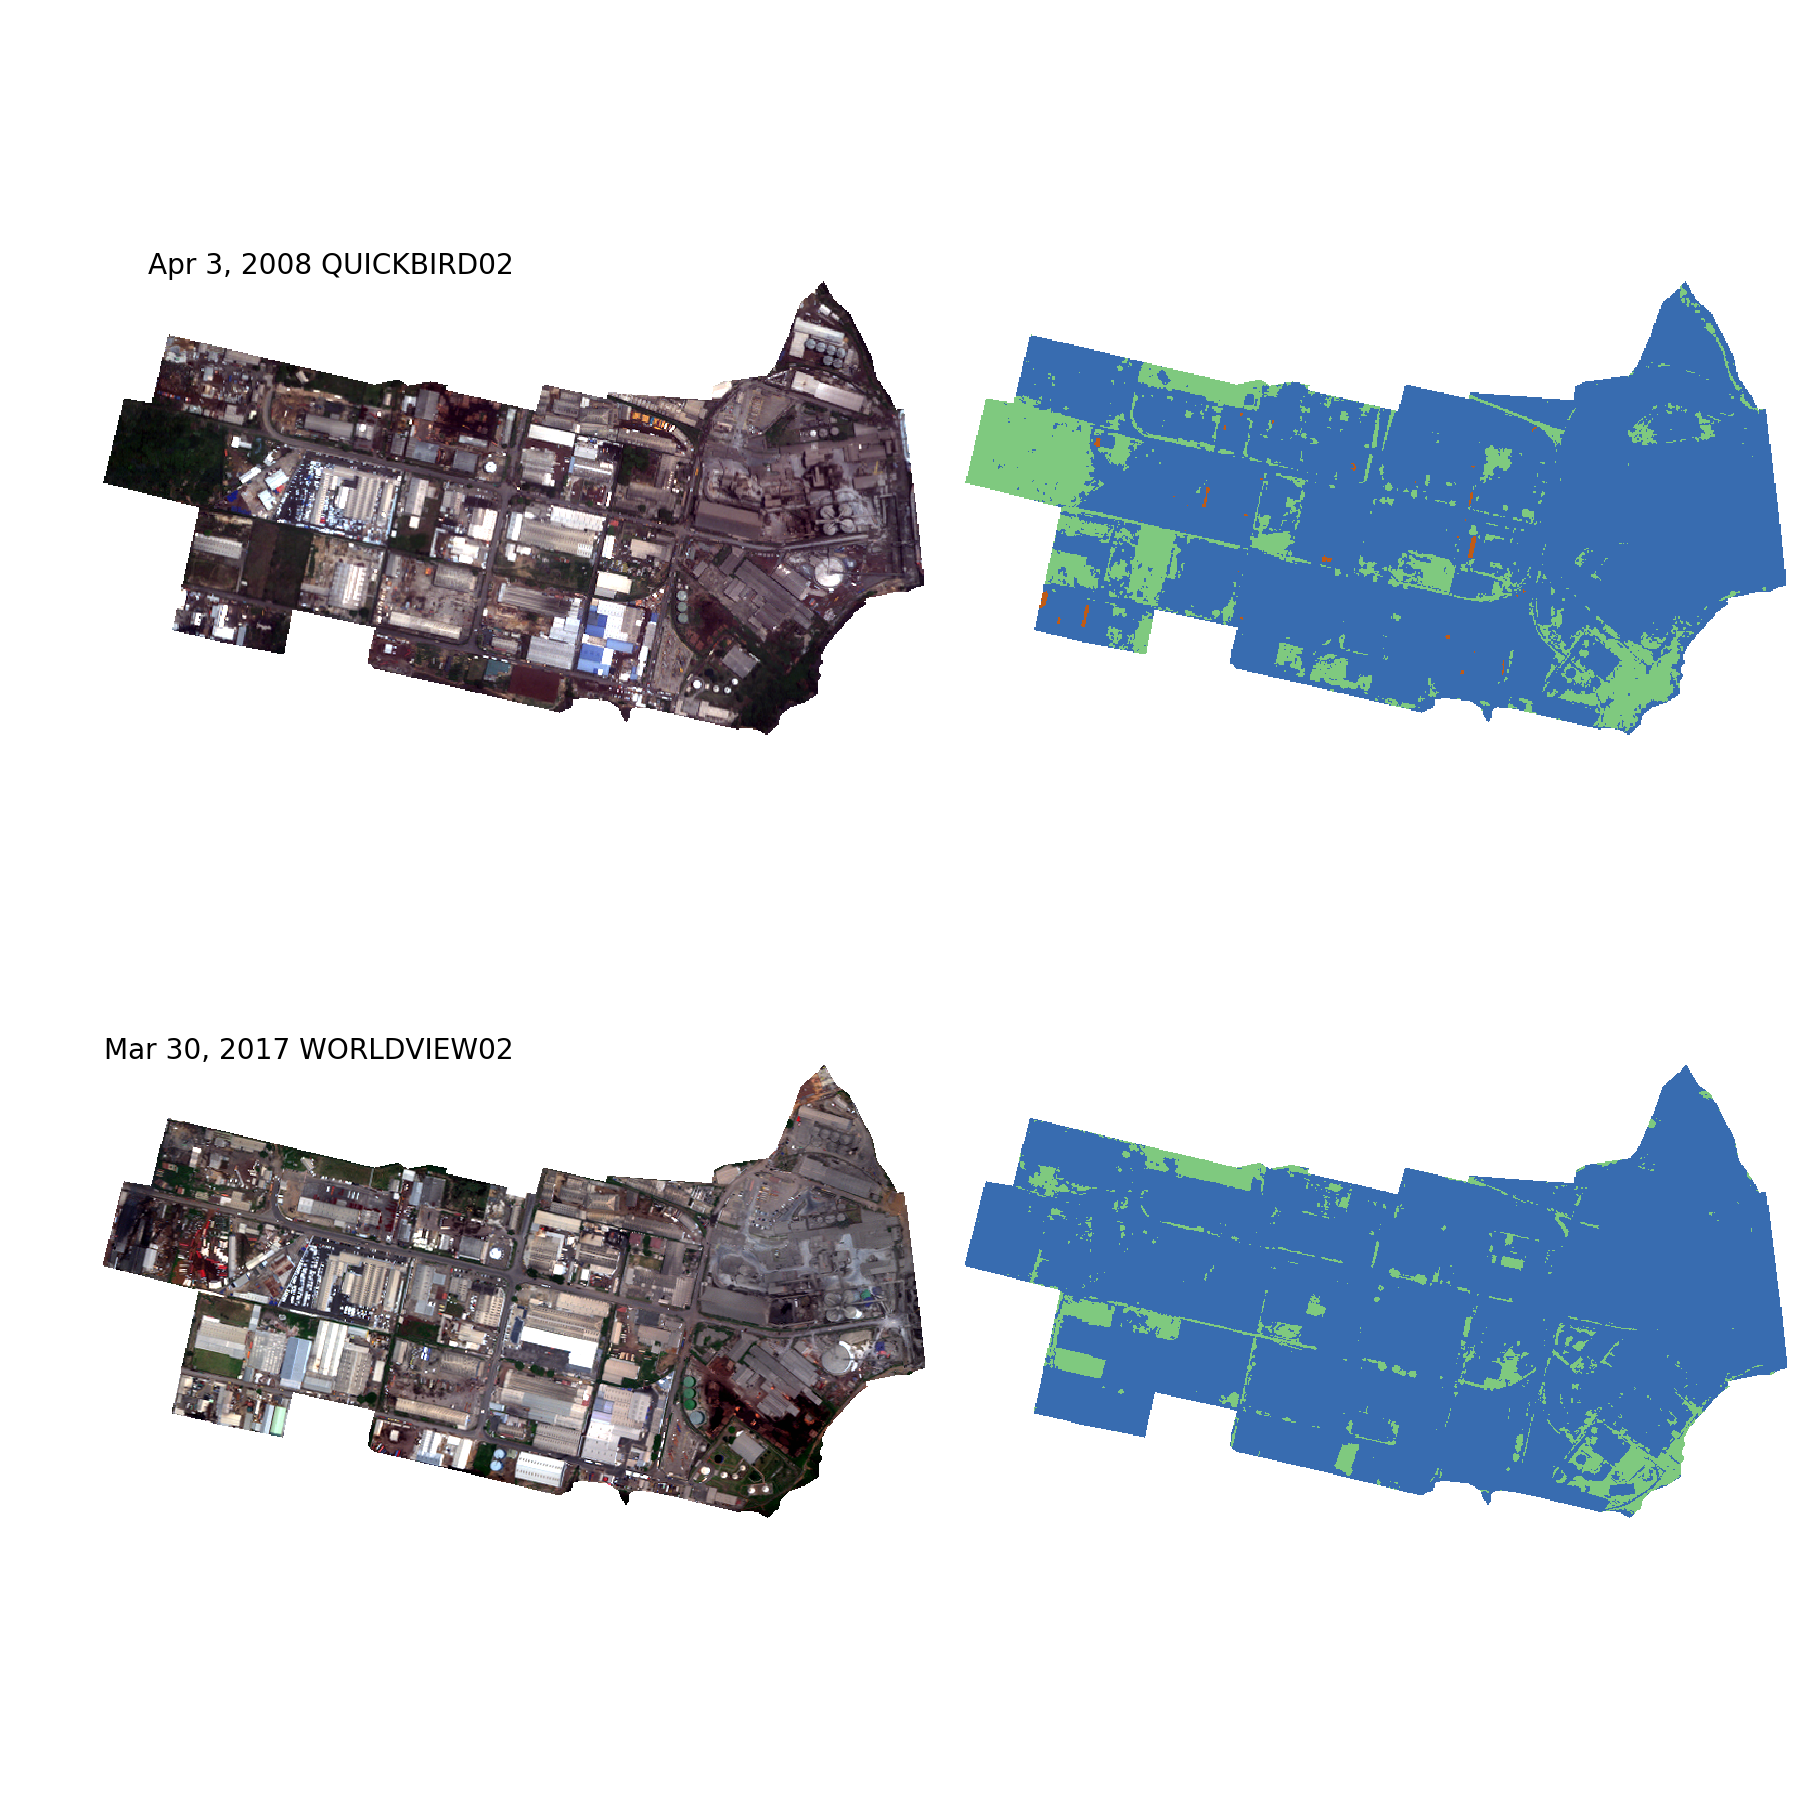
The resulting percentages are an accurate representation of what can be seen from the images with the transfer of green space to built upon.
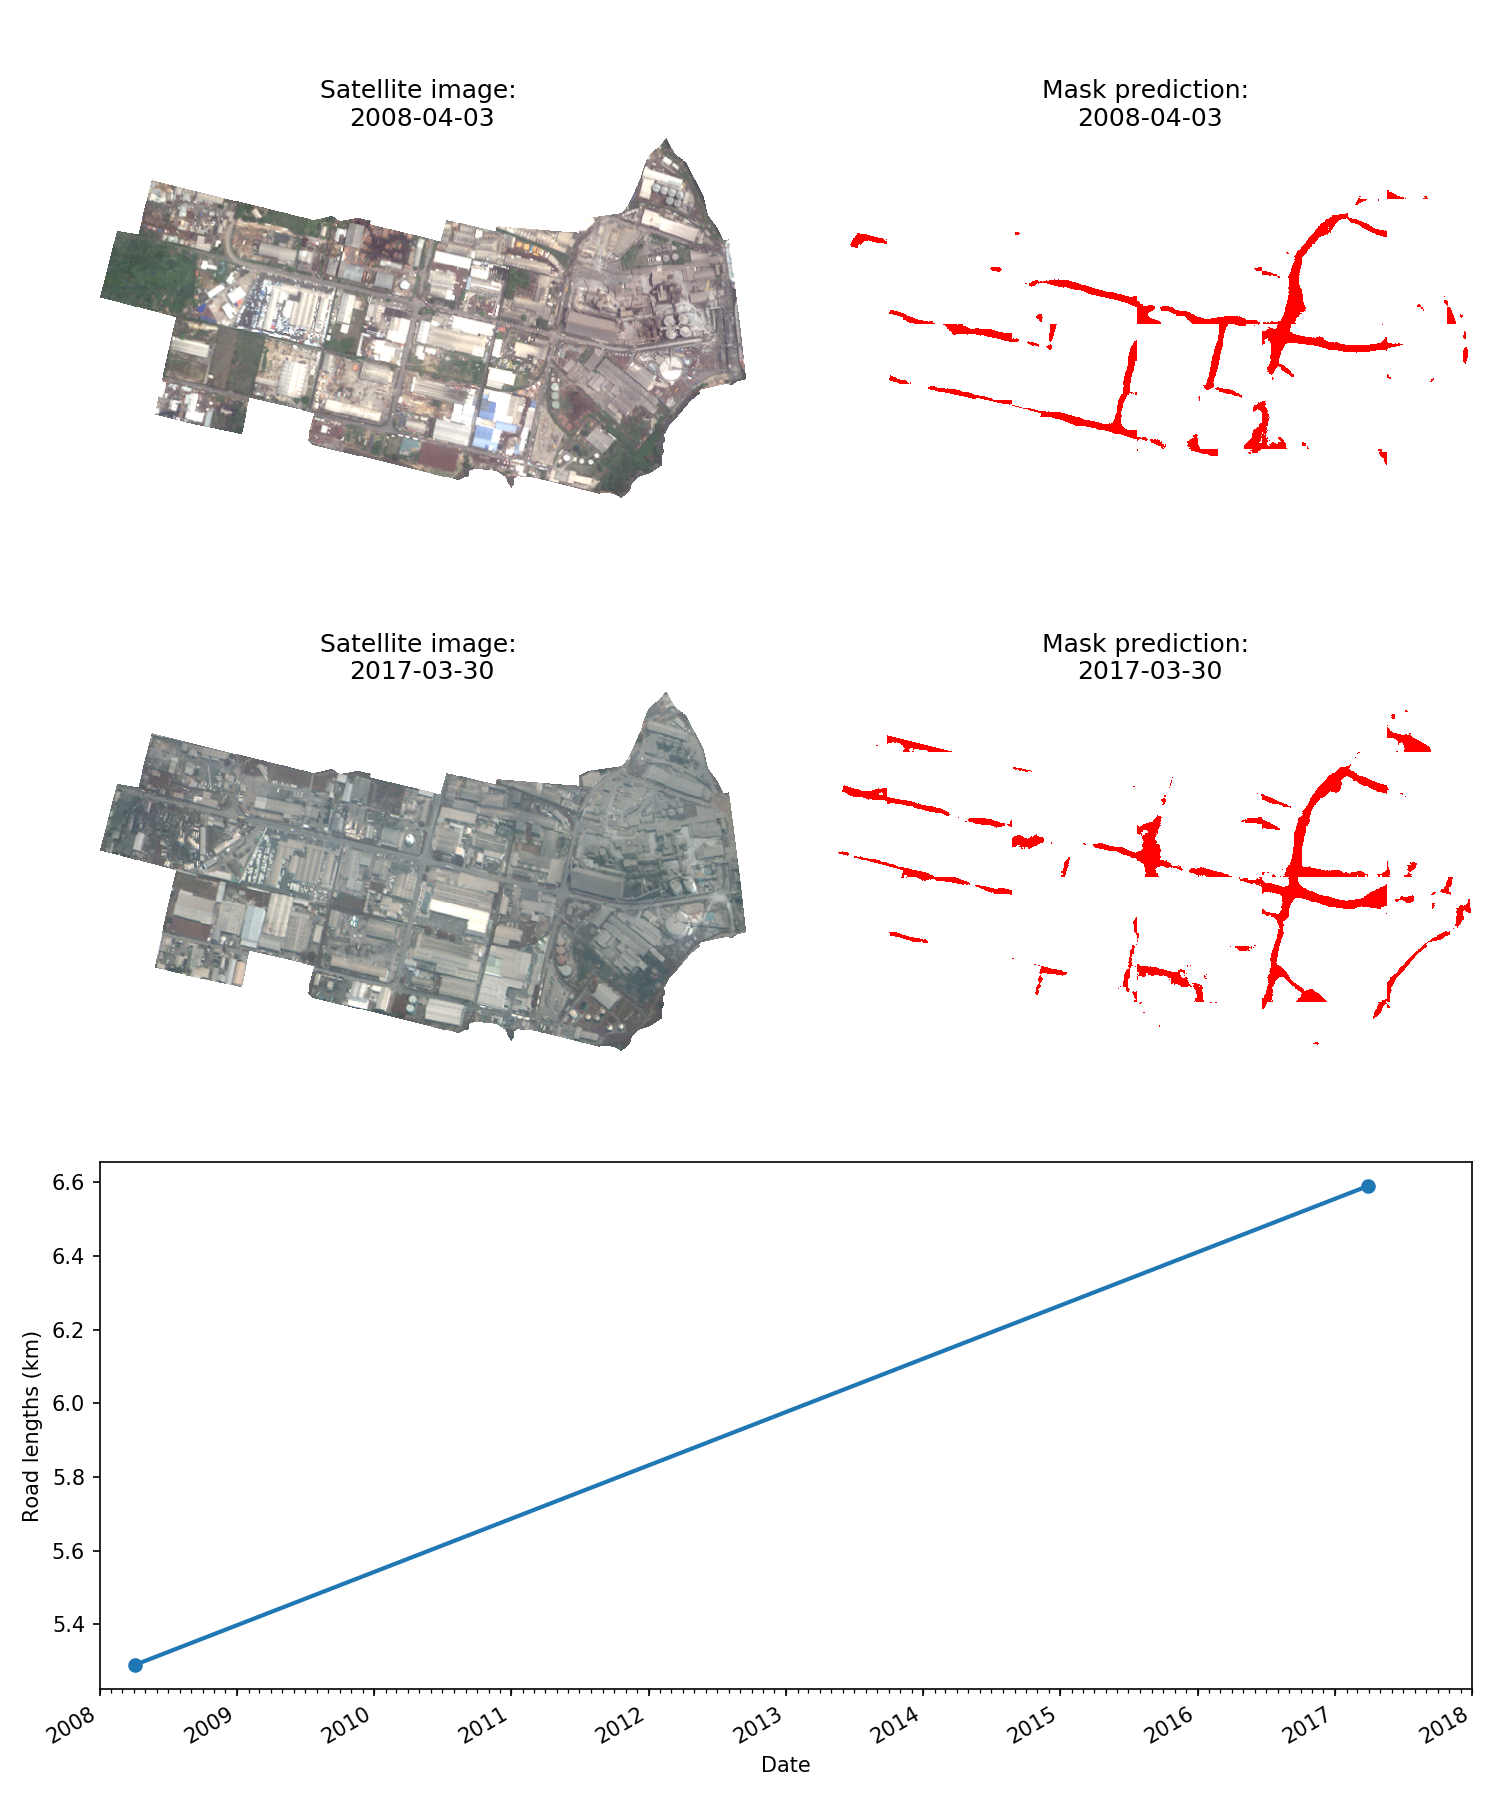
Transport Infrastructure
The total length of roadway (in km) was calculated using imagery from Digital Globe's Quickbird-02 and Worldview-02 satellites. Here, Skynet gives a reasonable road mask though there is room for improvement as many roads are incorrectly severed.
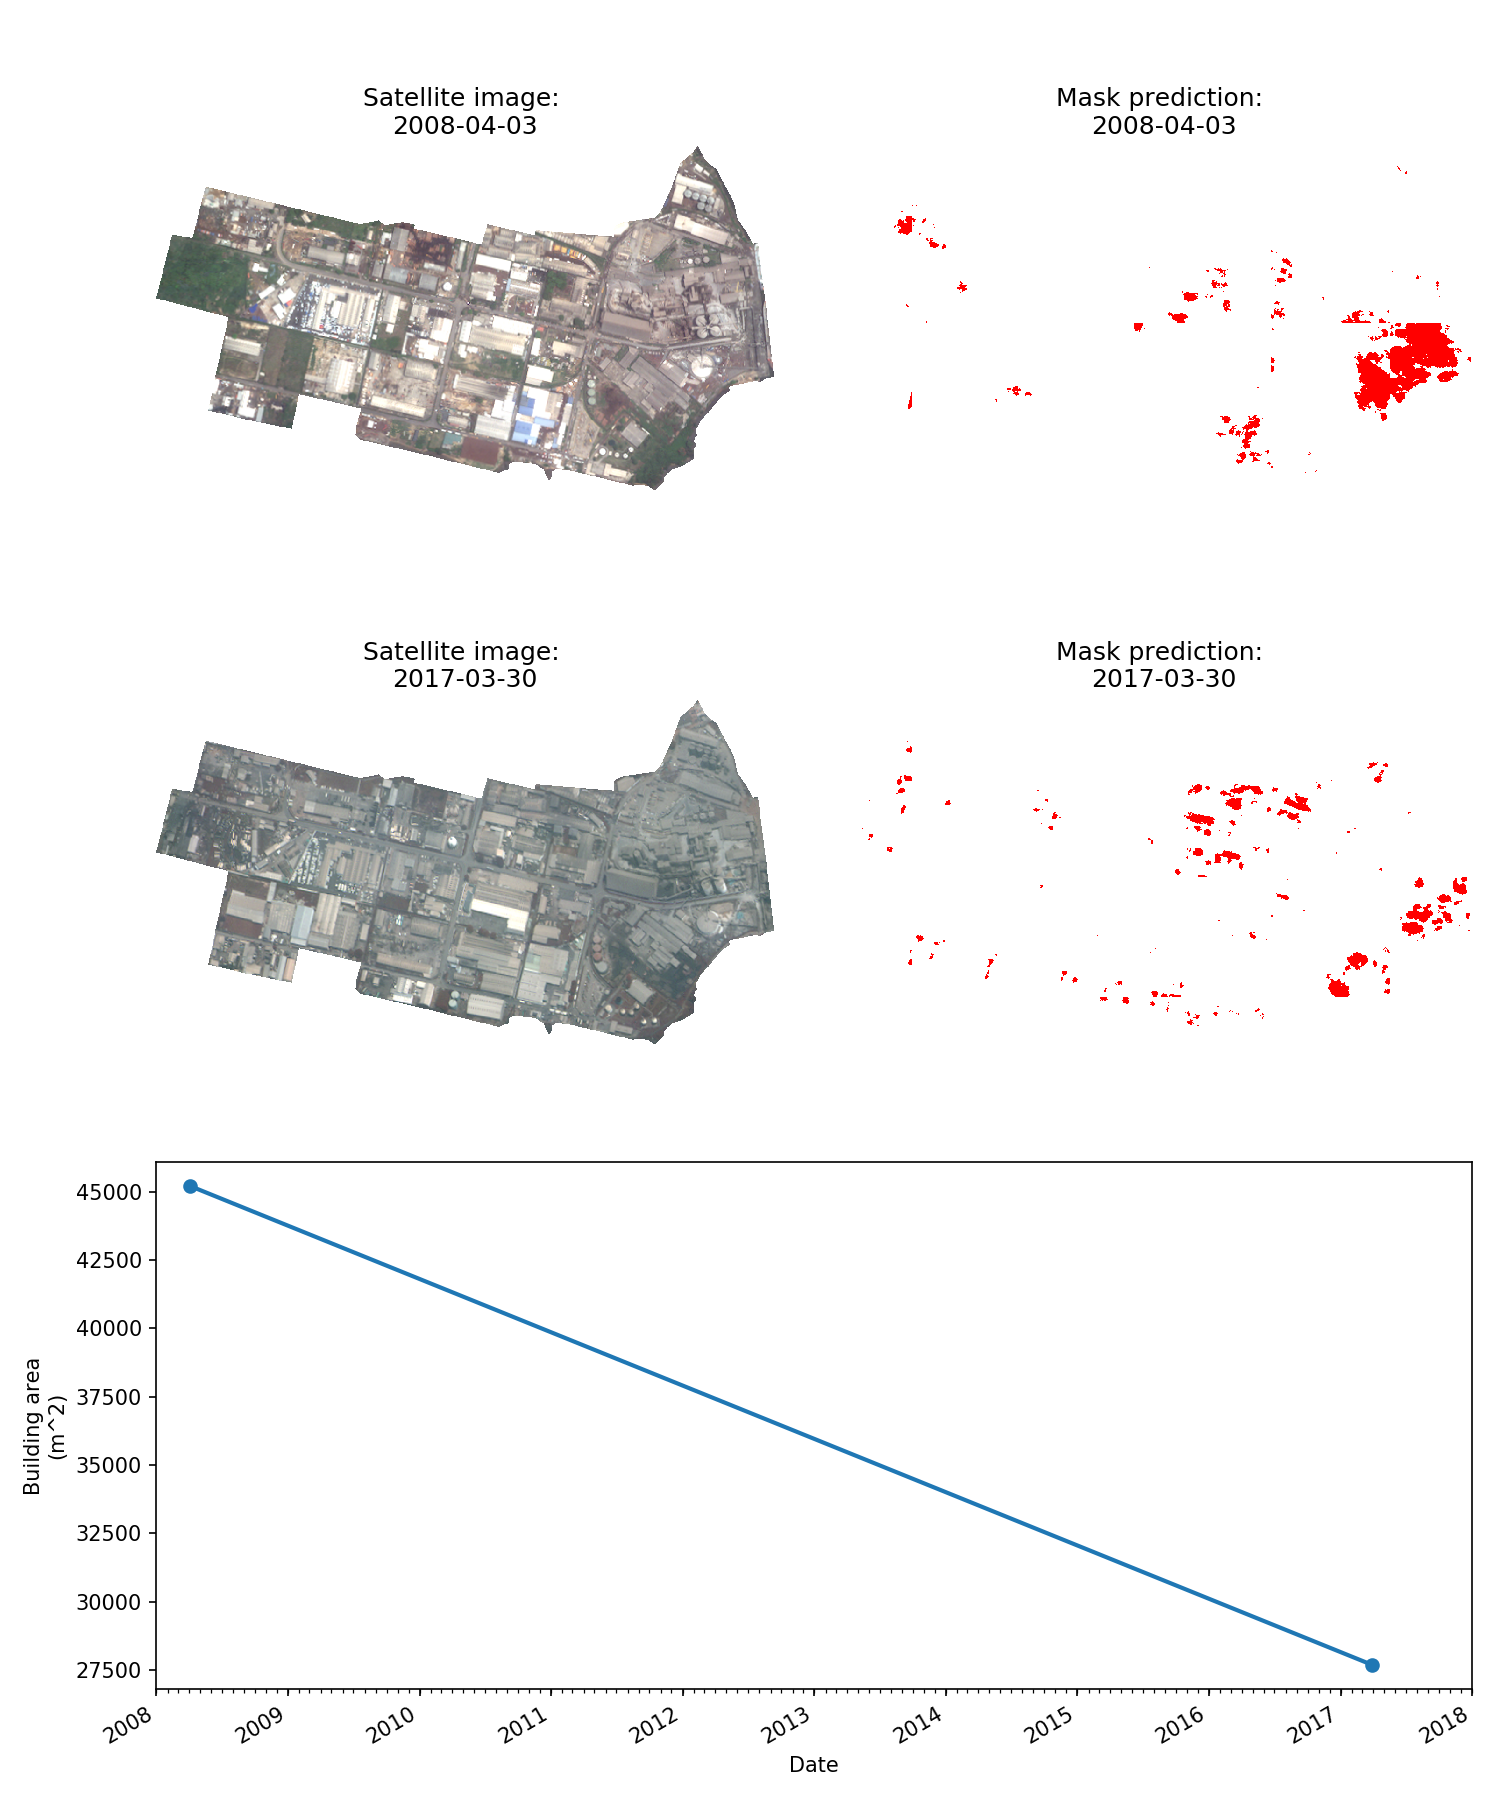
Building Footprints
The total building area (in m^2) was calculated using imagery from Digital Globe's Geoeye-01 and Worldview-02 satellites. Here, Skynet misses many buildings. This could be because of the low contrast between building roofs or because the model was trained using a large training data set from a different area of the world.
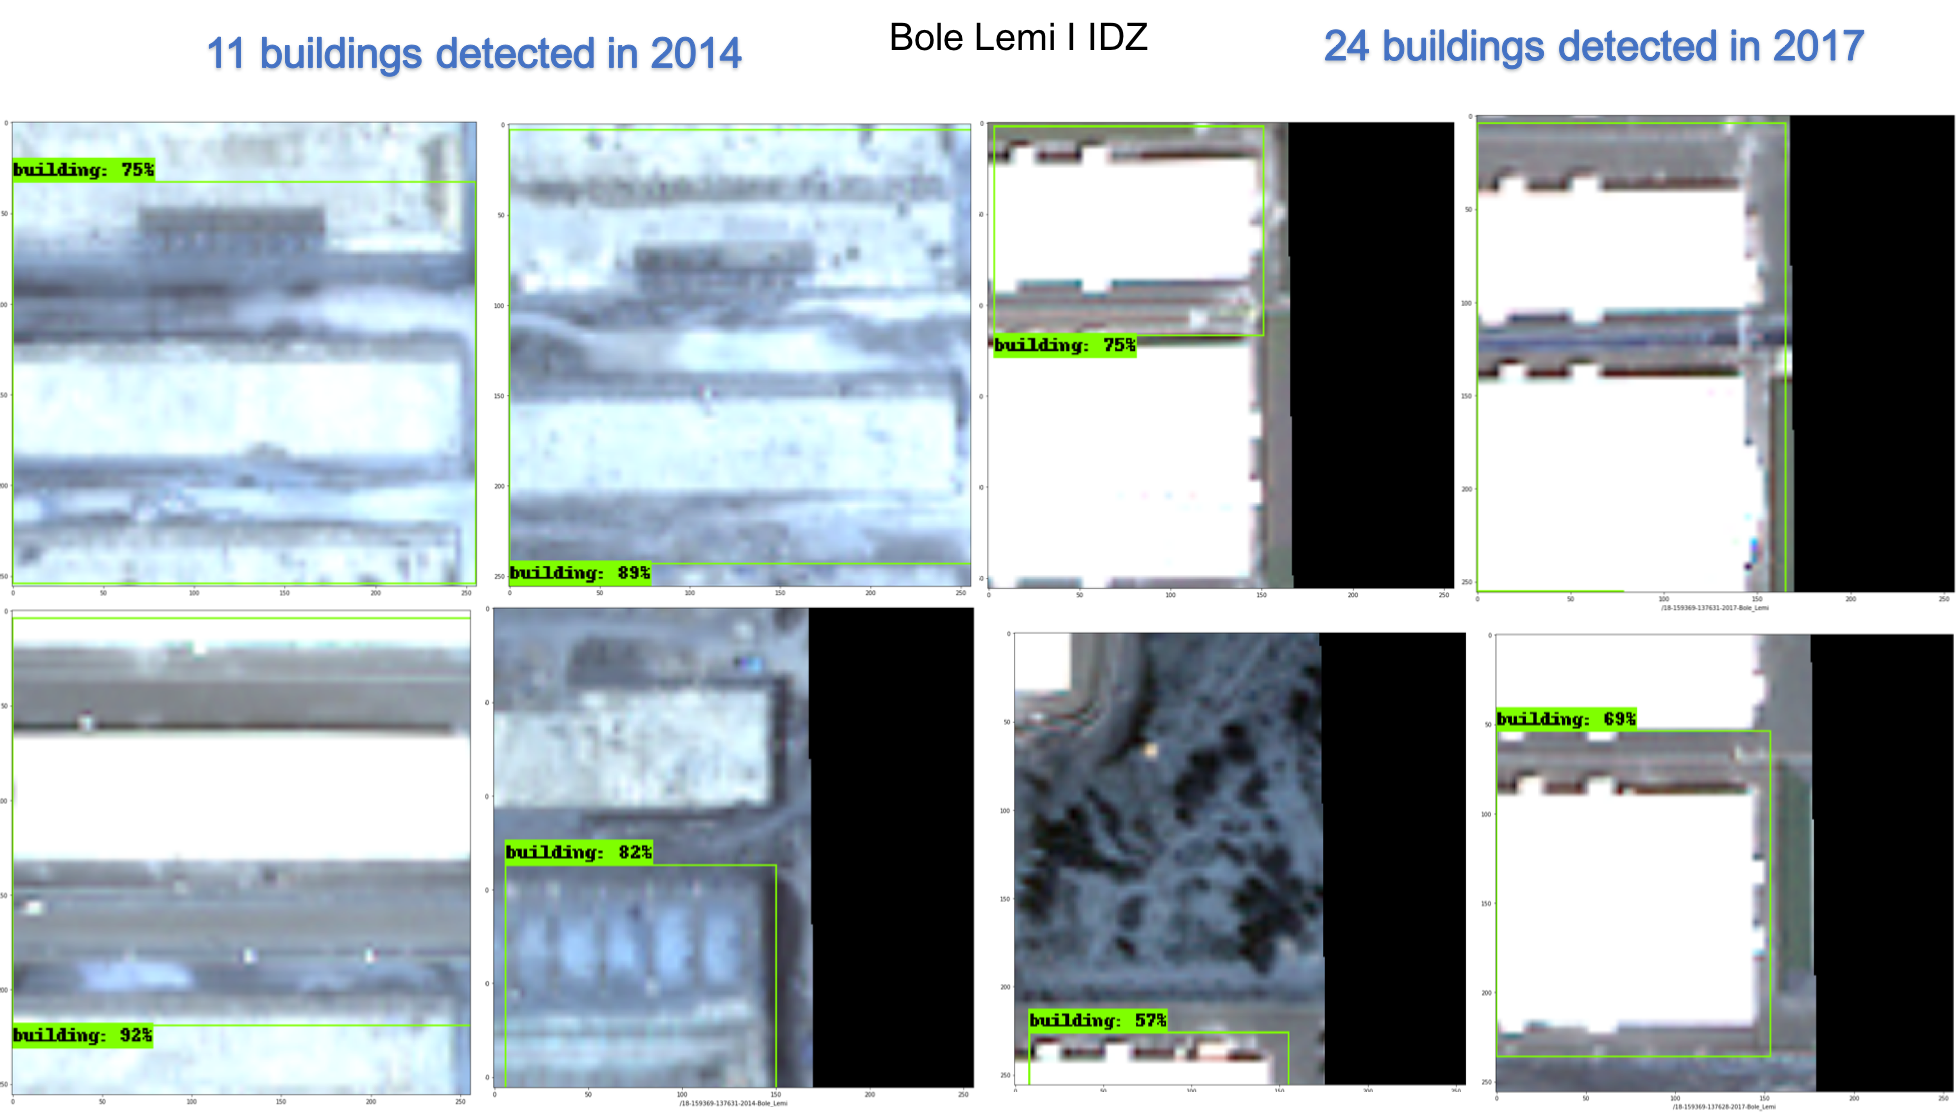
Building Counts
Our Tensorflow object detection neural net was able to detect the buildings from two imagery in Bonaberi Douala. We detected 30 buildings in 2008 and 36 buildings in 2017. The deep learning could not pick up and count small buildings but was able to detect bigger ones pretty well. The object detection neural net was trained with Open Street Map (OSM) building footprint info and Digital Vivid base-map imagery .The poor detection performance of our model might cause by less small buildings training dataset from OSM, as well as the two sense of imagery are more smoggy than other sites.
Electricity Consumption
Electricity consumption is highly correlated to a region's economic activity. To estimate electricity consumption, we used the Visible Imaging Radiometer Suite (VIIRS) Day/Night Band (DNB) imagery to correlate nighttime light radiance. Specifically, monthly VIIRS DNB product from The Earth Observations Group (EOG) at NOAA/NGDC was used.
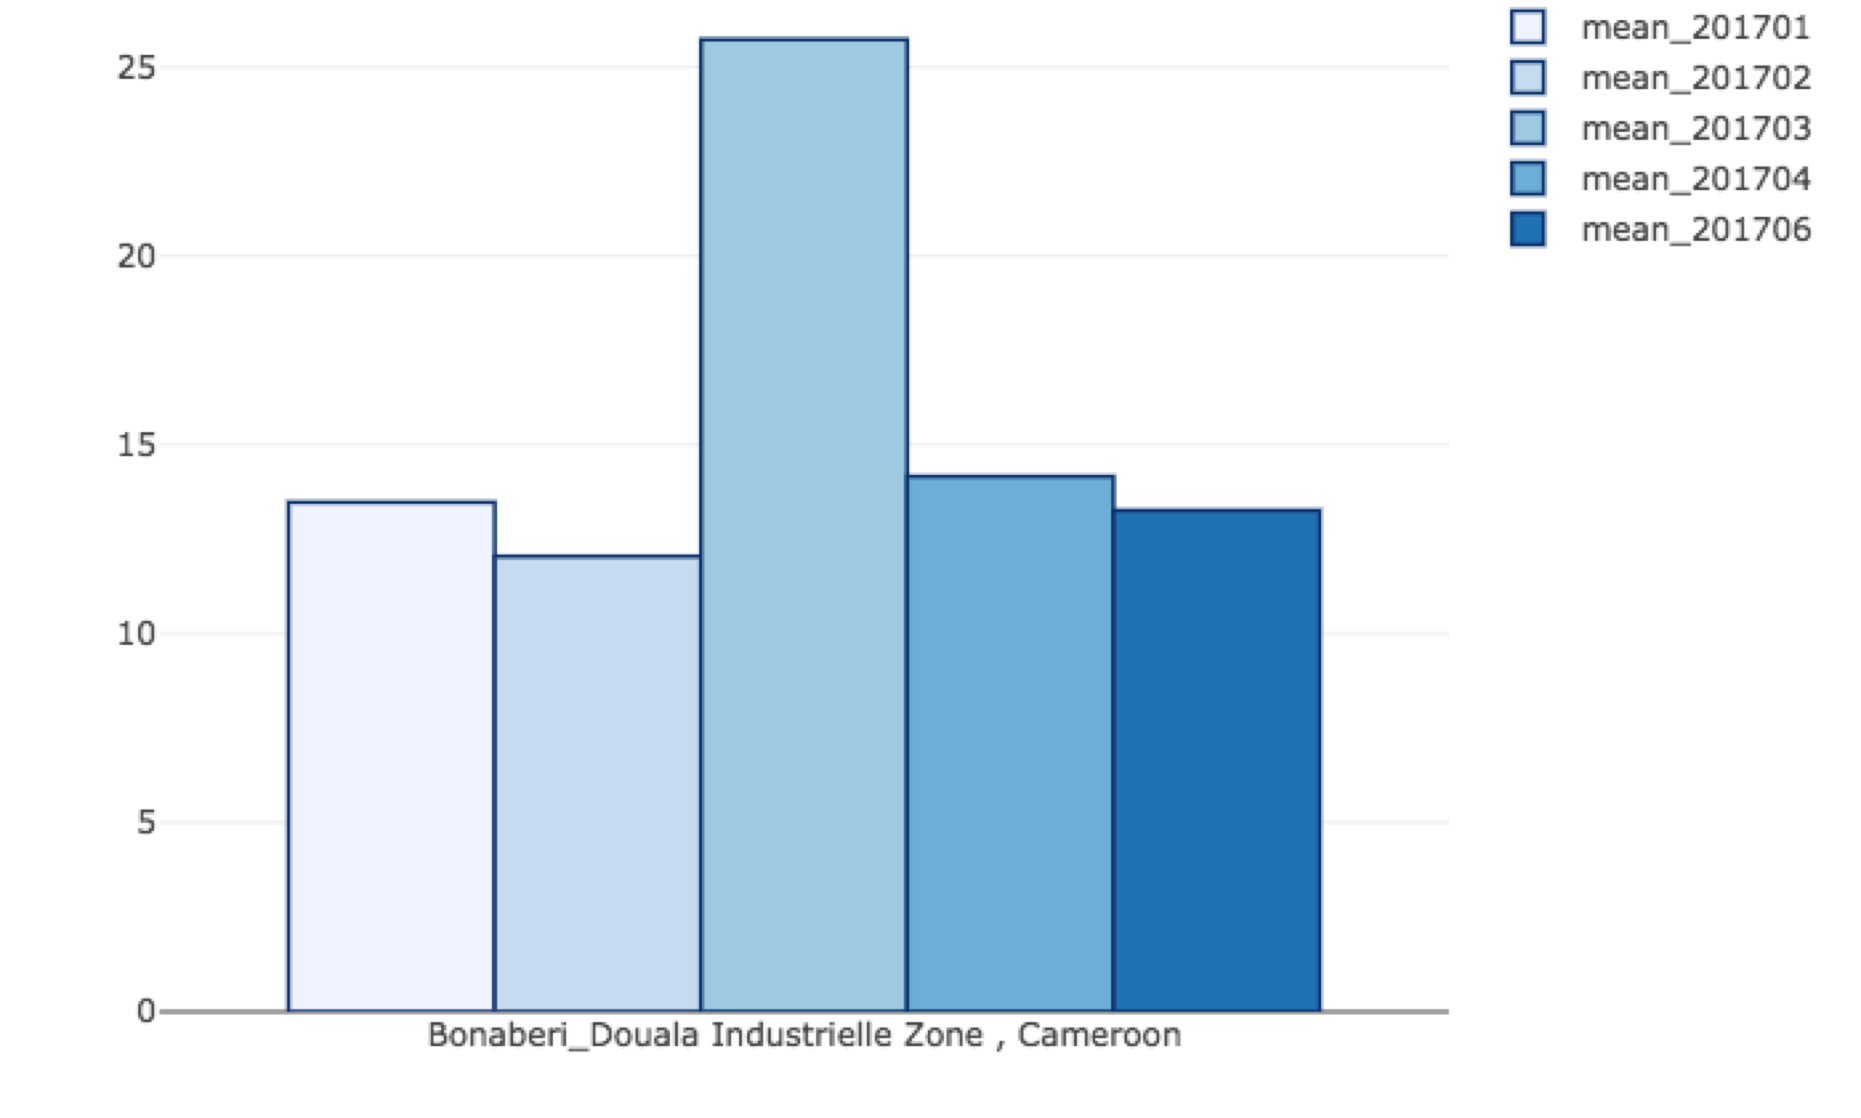
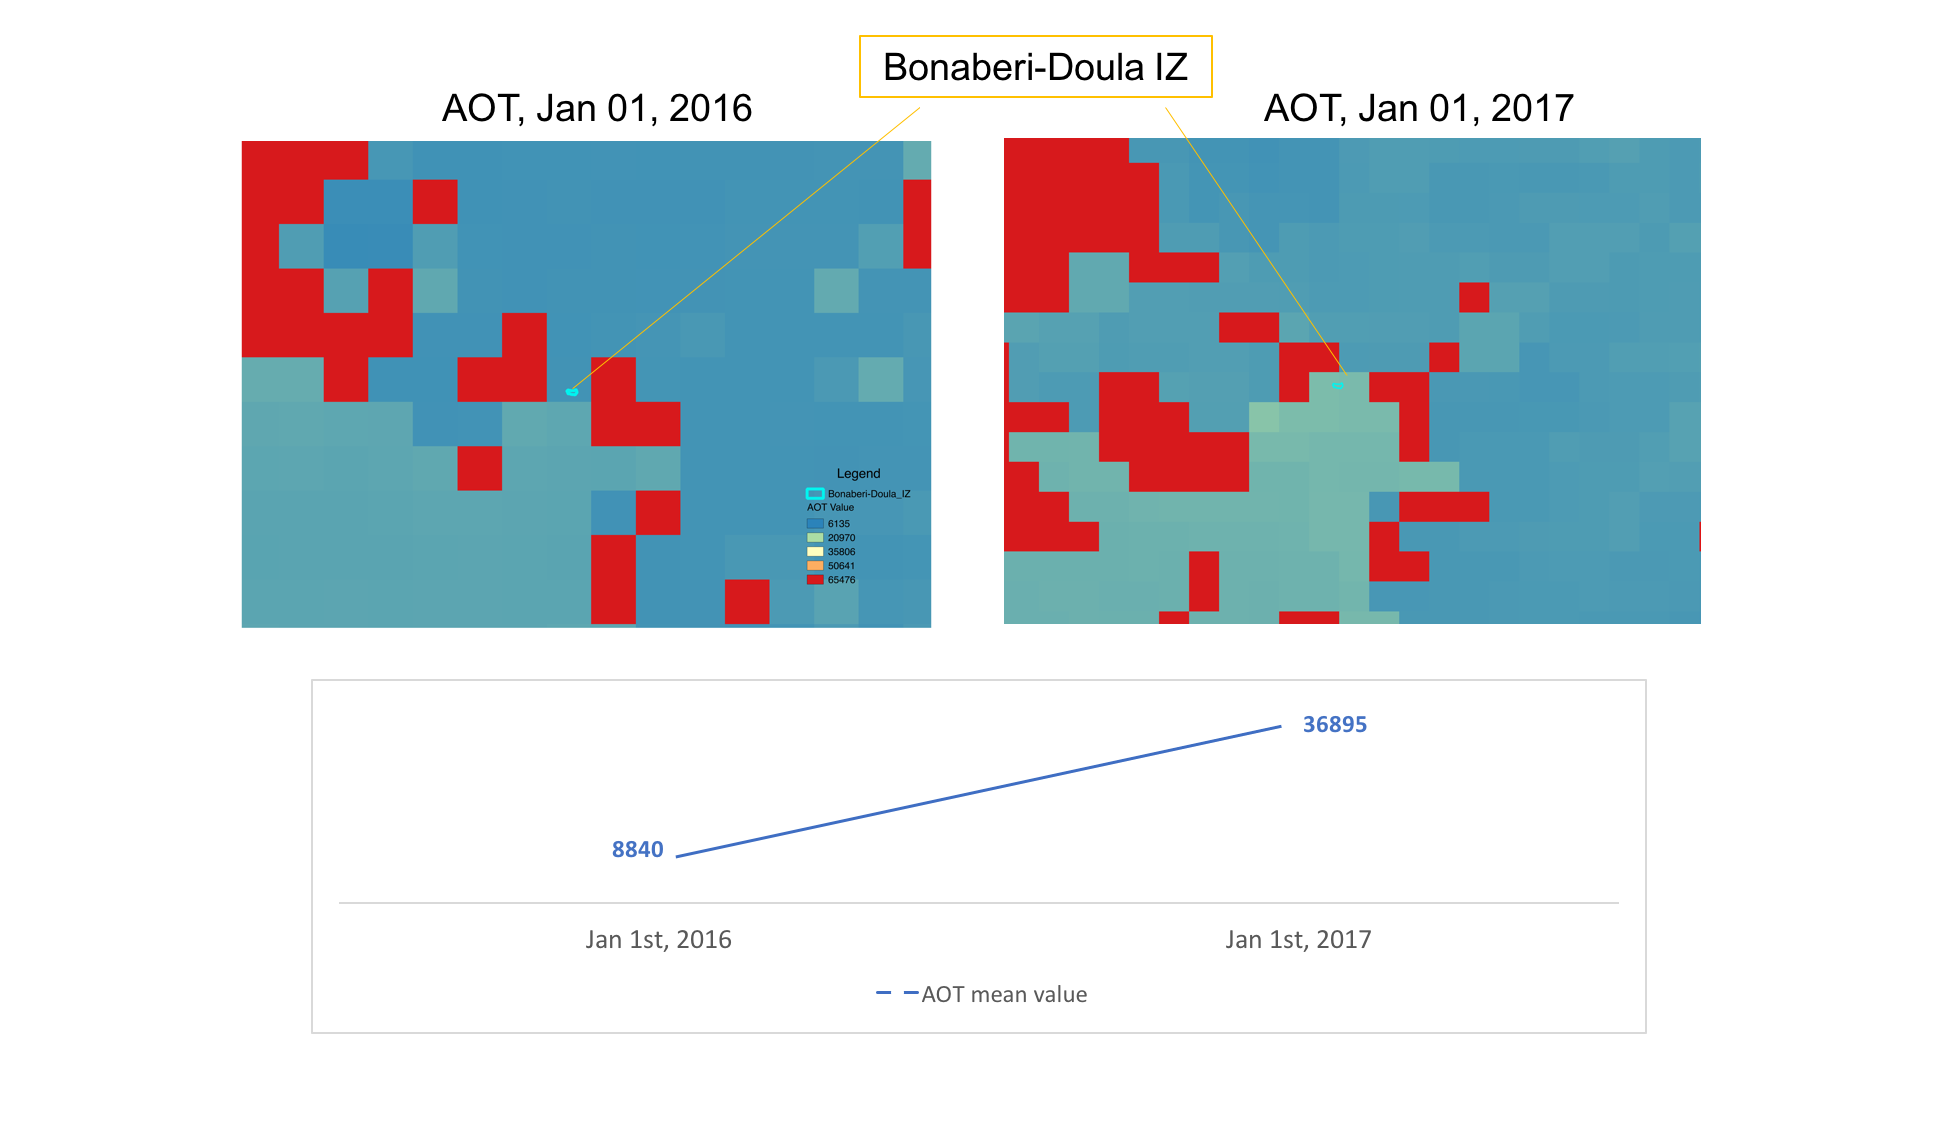
Pollution
Air quality and air pollution can also be monitored through VIIRS satellite imagery. Aerosol optical thickness (AOT) of VIIRS was obtained and processed as a proxy for air pollution indicator. Because it is related to the particulate matter, e.g. PM2.5, concentrations in the atmosphere, AOT is widely used for air quality and pollution applications. AOT imagery is recorded and updated daily at 6 km resolution.