Results
Coega IDZ
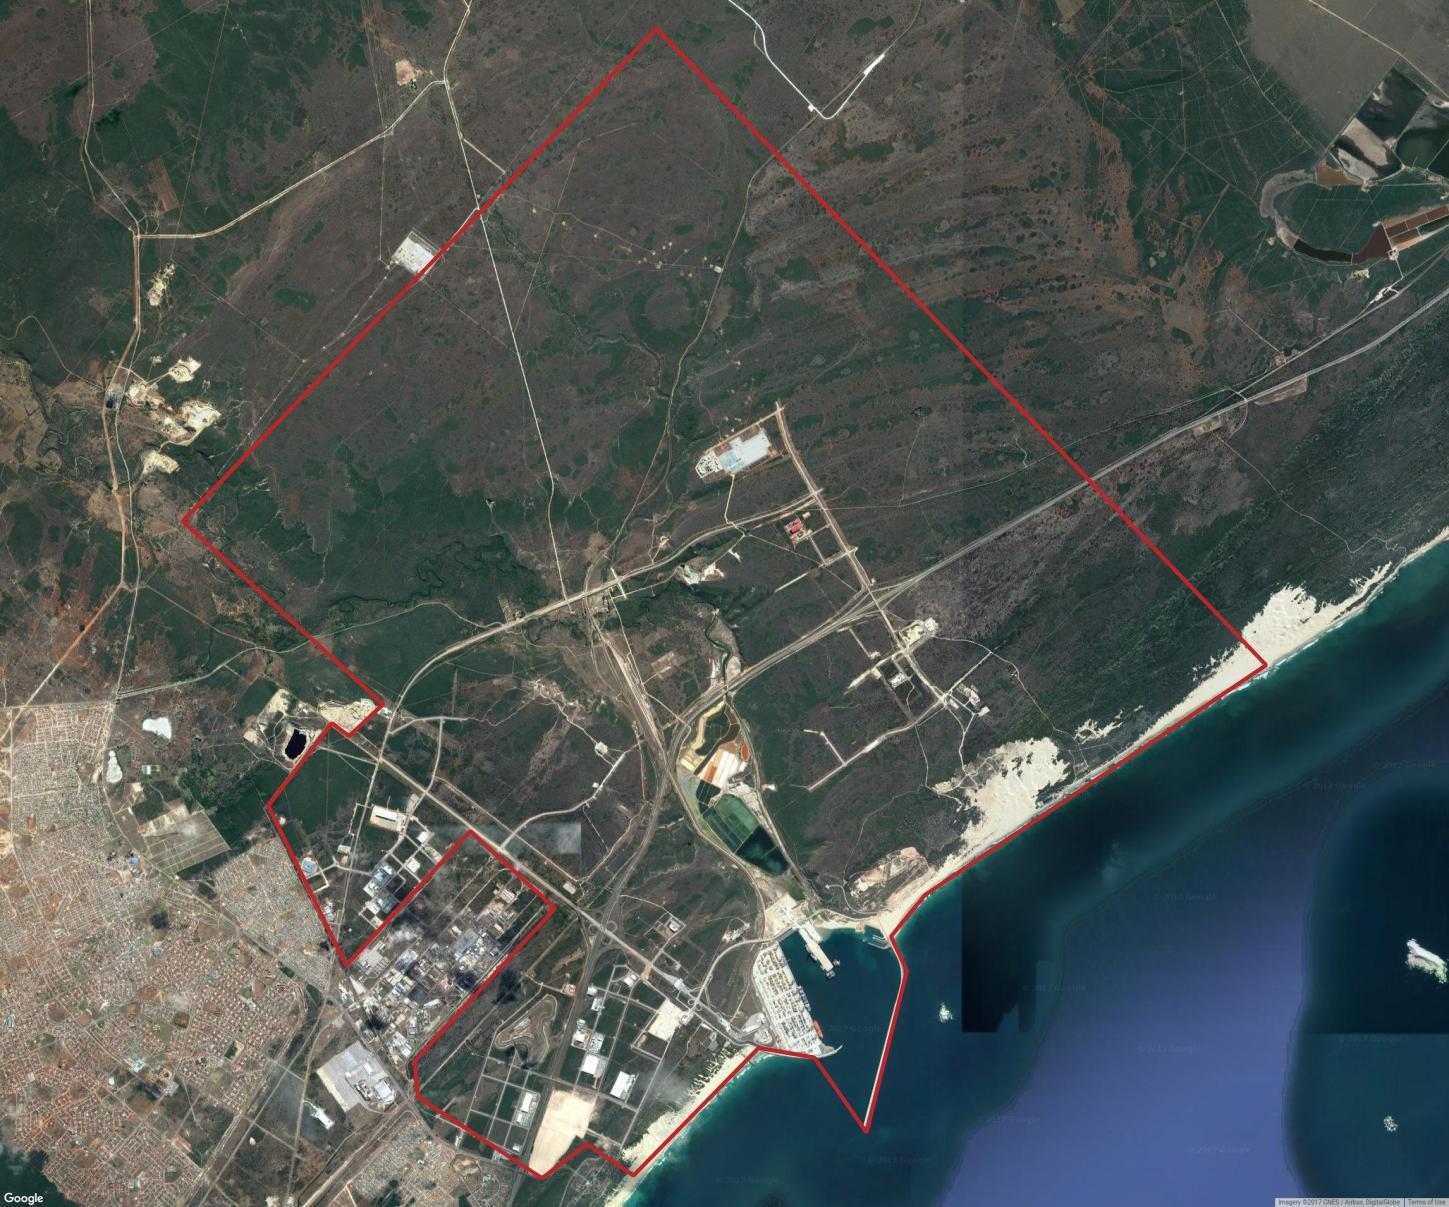
The Coega Industrial Development Zone (IDZ) at Port Elizabeth, South Africa was established in 1999. It lies adjacent to the largest port in the southern hemisphere, the deep-water port and transhipment hub of Ngqura. It is a very large site of 11,500 hectares divided into 14 zones, with 6 dedicated clusters (intended to reduce costs and increase efficiency through sharing of services): automotive, agro-processing, chemicals, business process outsourcing, energy and general manufacturing.
The site is directly connected to South Africa’s national rail and road networks and sea-based east-west trade routes. The aim of the Coega IDZ is to drive local and foreign investment in export-oriented industries and to position South Africa as a trade hub. In addition the government’s goal was to either create or secure “between 36 500 and 57 500”.
The IDZ continues to attract a number of major investments valued at over R75-billion, including PetroSA’s Project Mthombo, and Chinese automotive firms with more than 36 operational investors. On the back of the continuing reported success at this site, the Coega Development Corporation (CDC) is looking to establish a cargo airport to improve aeronautical and aerospace industrial manufacturing capabilities in zone 14 of the IDZ.
- Size analyzed: 10,160 hectares
- Established: 1999
- Phase: Operational
The Coega zone was far more challenging due to it's size. Processing times were far greater, and it was more difficult to work with the data.
Analysis
This is a long established and large site, with good infrasturctural connections and investment from external firms. Its goal was to empower foreign investment and export activity, while securing/creating jobs in the local economy, and its well documented investments supports this proposition However, in order to provide formal automated assessment of how well those economic goals have been achieved, and in particular to quantify the site’s contribution to economic expansion in the region, the following considerations must be made:
- Due to the age of the site, analysis can only really be made longitudinally via analysis of historical EO imagery, and derivation of land use classification models, night light levels and building footprint analysis (set against pollution data) - longitudinal CDR data simply won’t exist to support assessment of socio-demographic impacts.
- Even where impact upon traditional lagging economic indicators such as wage growth and GDP is assessable, delineating the IDZ’s contribution will necessarily be subjective.
Nonetheless, if available, analysis of current CDR data would allow assessment of international call activity and support inference of international freight movement - both potentially high impact micro-indicators of current levels of foreign investment and export activity. Further analysis of manufacturing expansion (via building footprint size) is a known “leading” economic indicator, and is readily inferable from EO analysis. And while job creation is difficult to identify via automated indicators (again due to the age of the site), examination of current local network activity would allow derivation of high confidence estimates of employment levels in the zone, providing supporting insight in quantifying economic contribution..
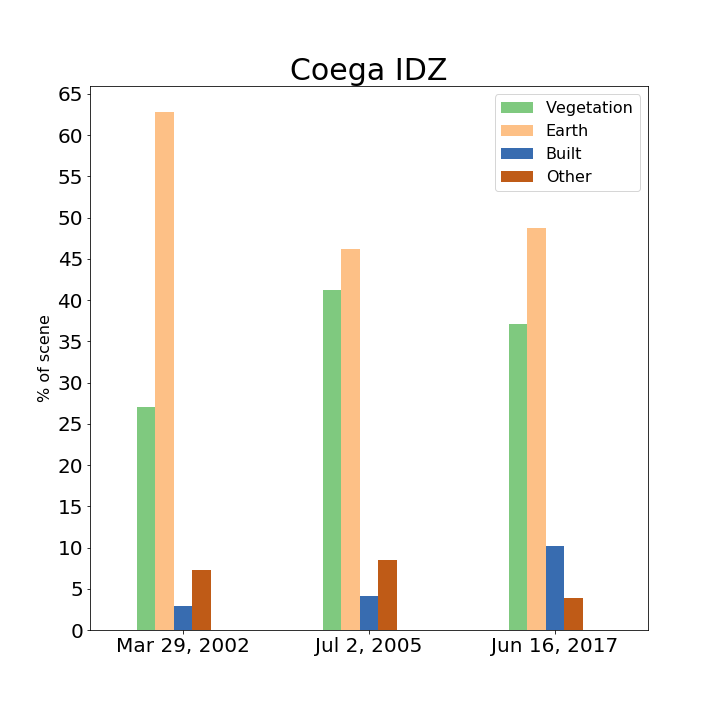
Land Classification
In addition to the processing challenges, the land classification clustering algorithm have more difficulty over larger scenes. Over the scene there can be far more natural variation and materials present than with the smaller zones. Using a small number of classes can cause different materials to be grouped together. While the other zones were segmented using 5 classes, Coega used 7 initially which were then labeled into the 4 final classes (vegetation, earth, built, other). Even with 7 classes there was some confusion between the beach and sand with built-up areas.
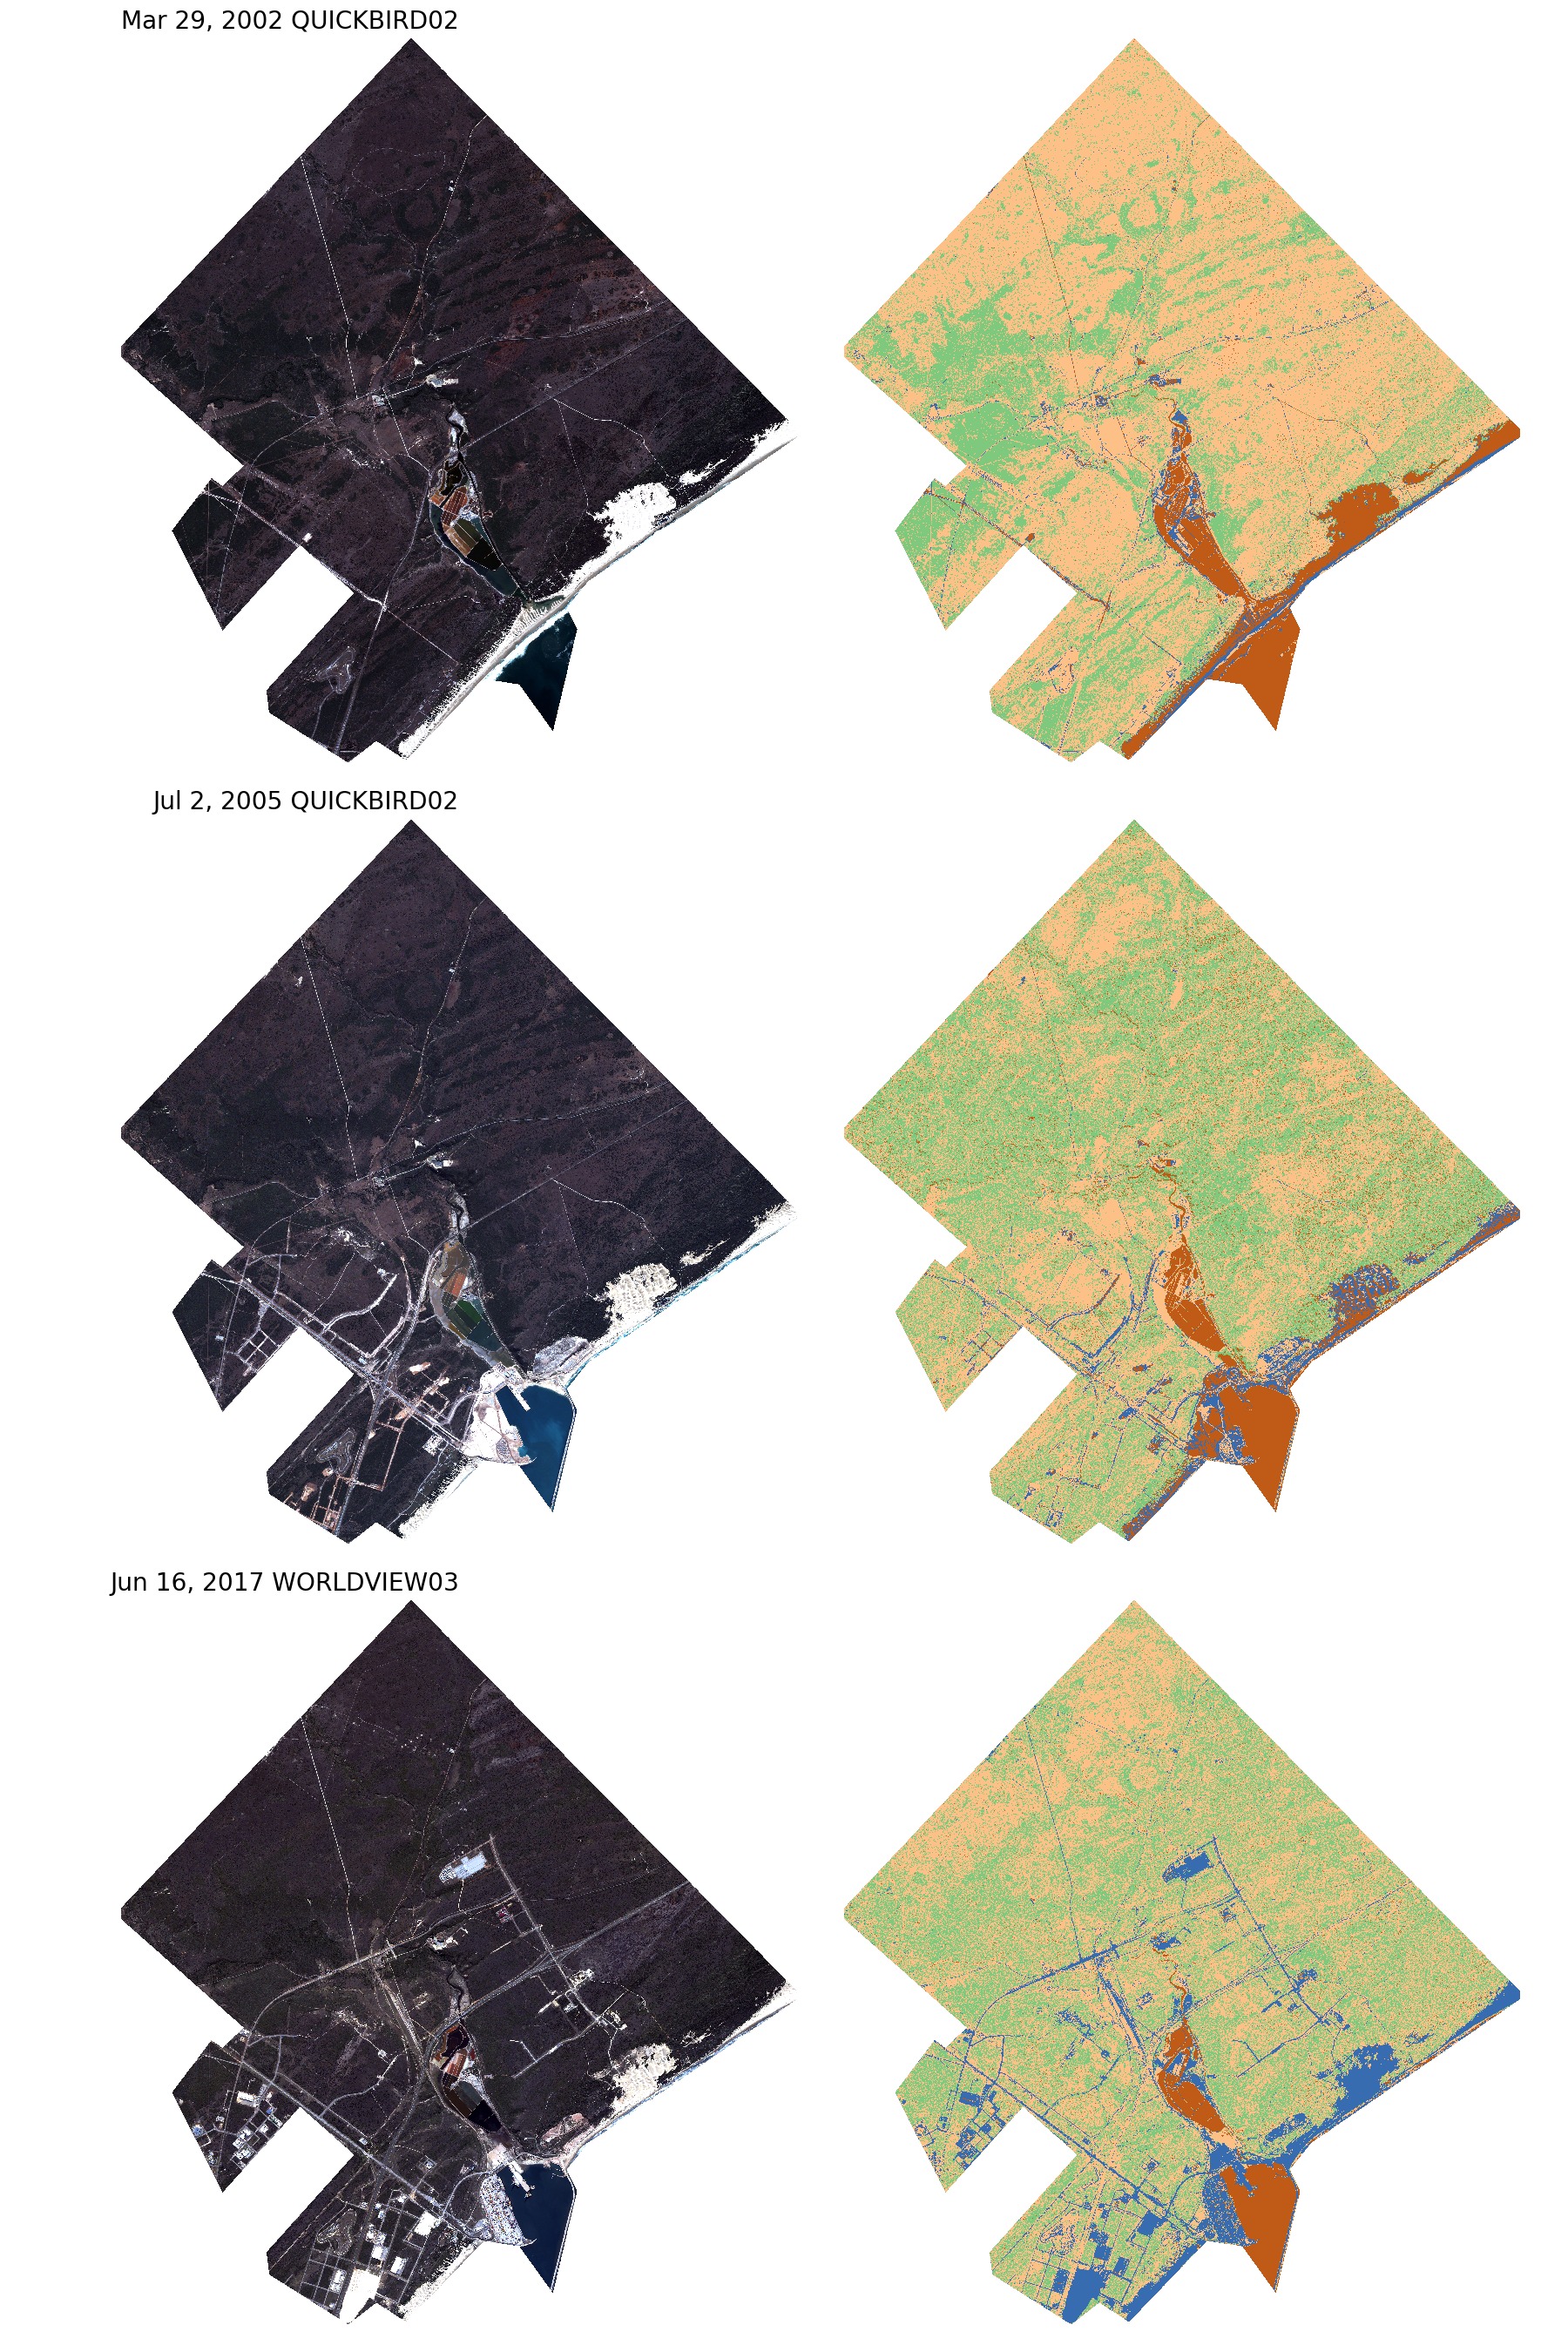
The classification of sand along the beacj as built area greatly inflates the percentage for the latest date, even much of the built up area was classified correctly. An increase in the number of classes makes labeling a more difficult process.
Electricity Consumption
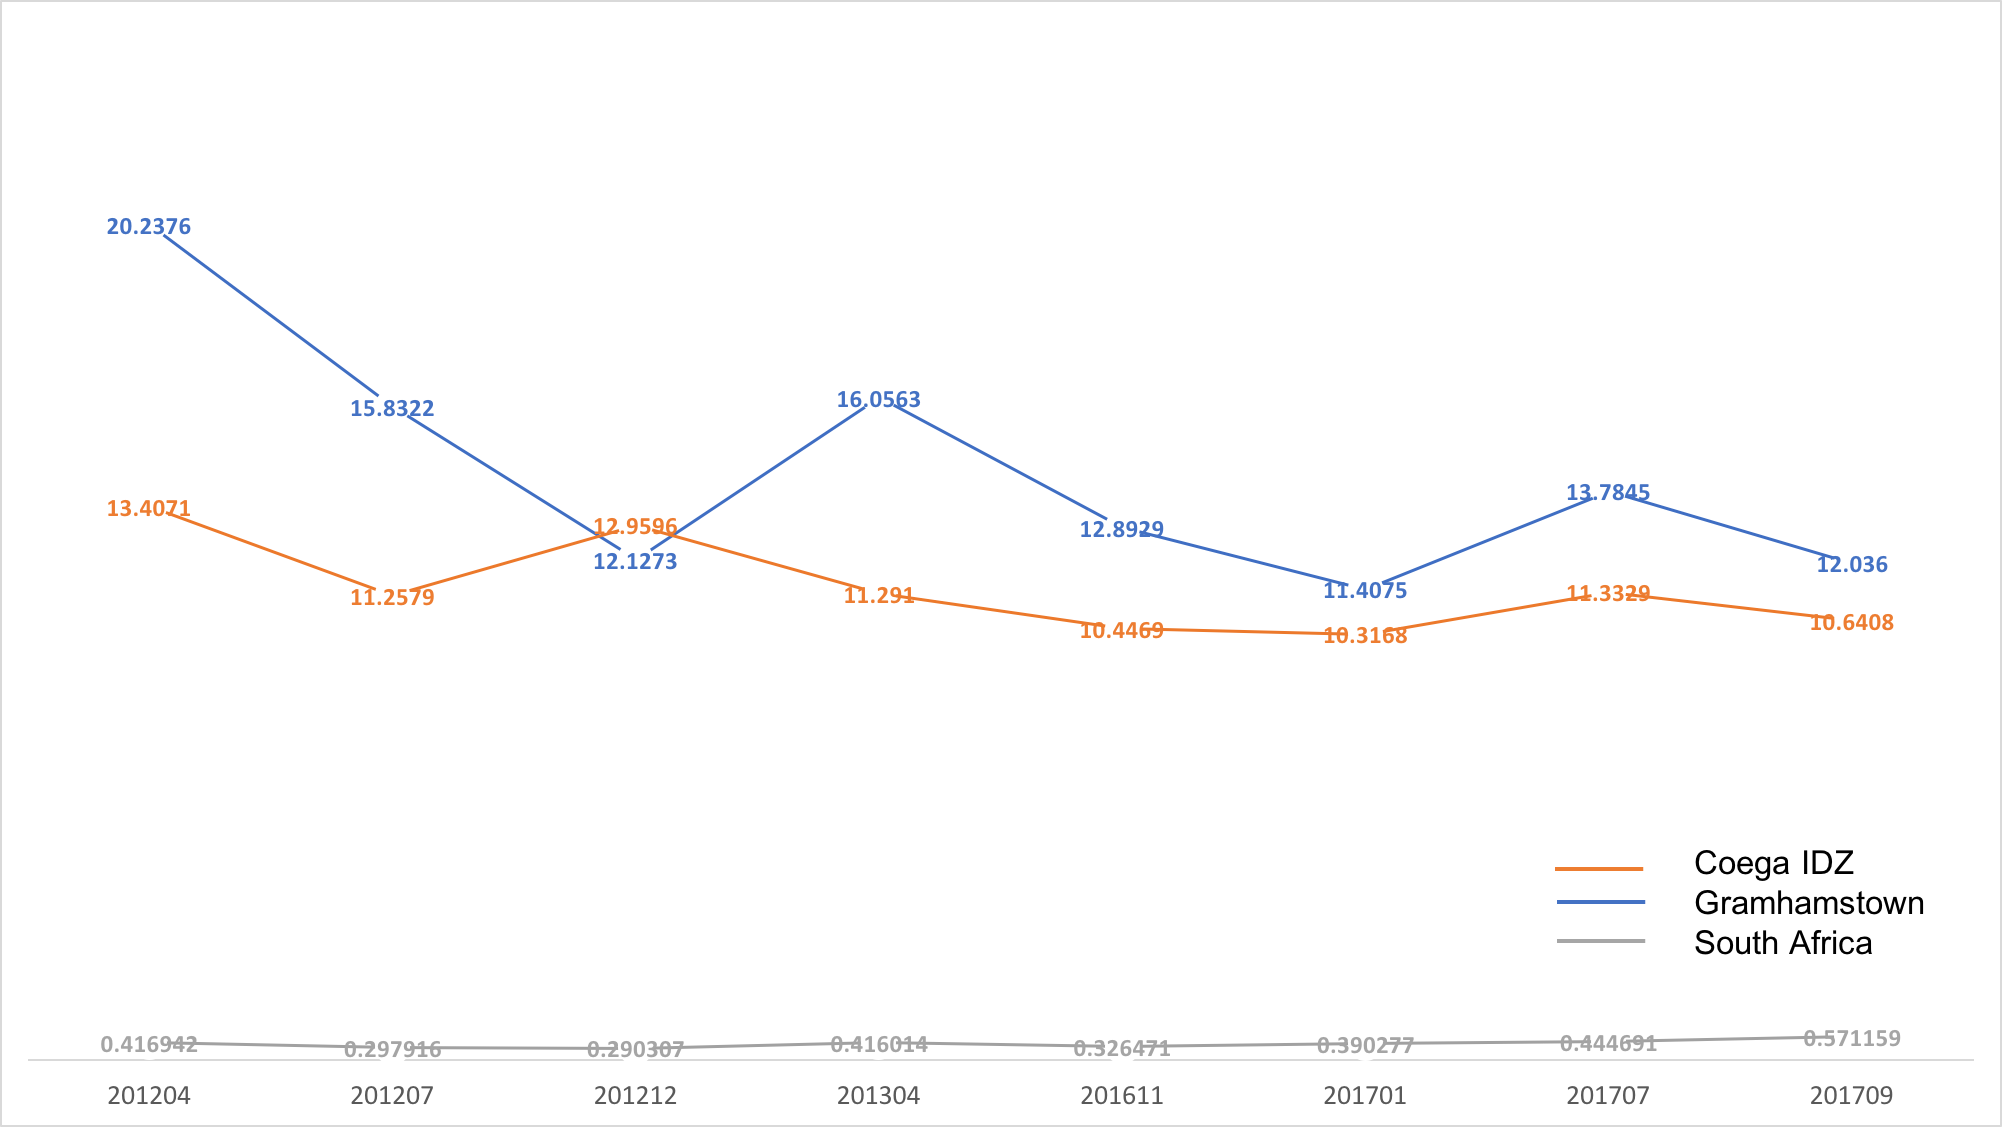
Electricity consumption is highly correlated to a region's economic activity. To estimate electricity consumption, we used the Visible Imaging Radiometer Suite (VIIRS) Day/Night Band (DNB) imagery to correlate nighttime light radiance. Specifically, monthly VIIRS DNB product from The Earth Observations Group (EOG) at NOAA/NGDC was used.
We put Coega IDZ side by side with its nearby city Grahamstown, and found Coega IDZ is using more electricity than the national level in South Africa. As a long-established (since 1999) SEZ sites, the mean electricity consumption of Coega IDZ exceeded Grahamstown around 2012, but overall it is lower than Grahamstown from 2012 to 2017.
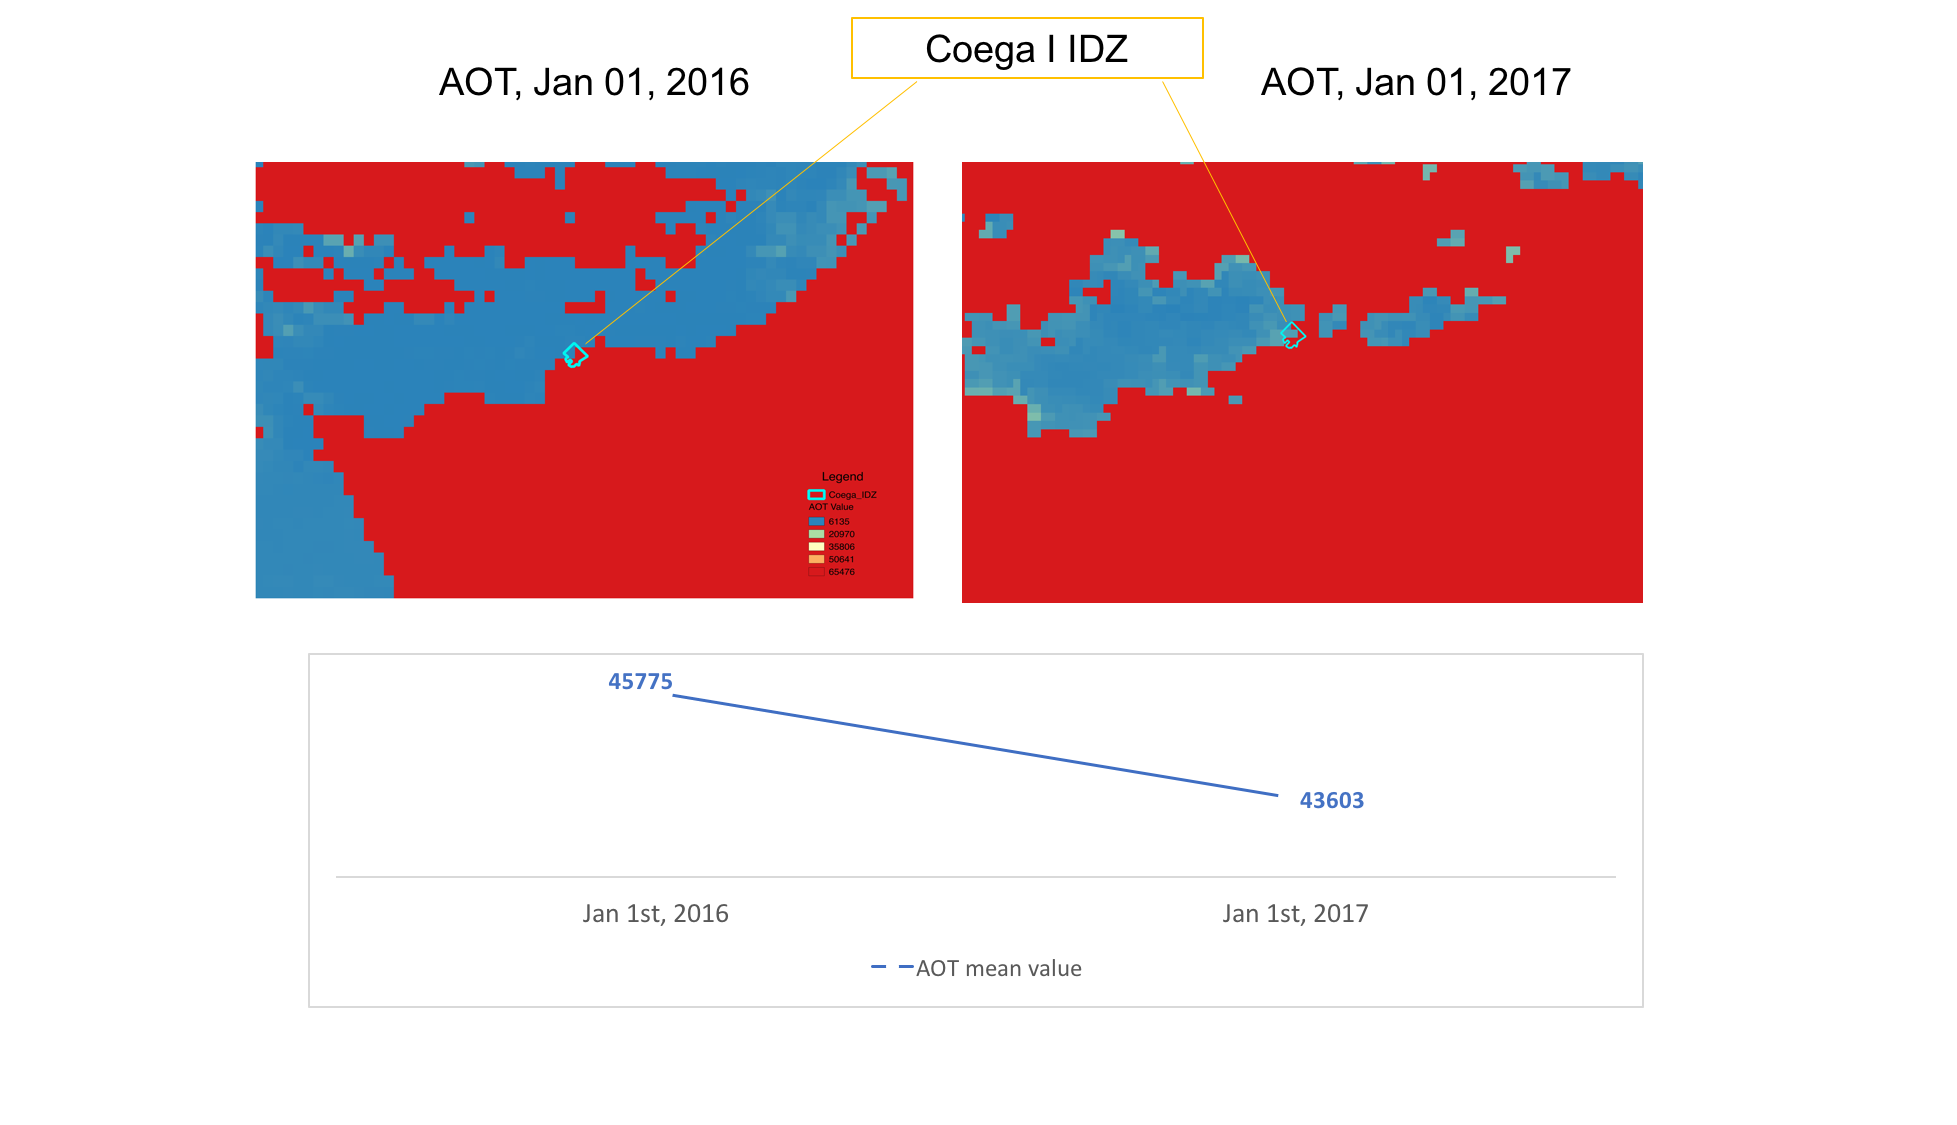
Pollution
Air quality and air pollution can also be monitored through VIIRS satellite imagery. Aerosol optical thickness (AOT) of VIIRS was obtained and processed as a proxy for air pollution indicator. Because it is related to the particulate matter, e.g. PM2.5, concentrations in the atmosphere, AOT is widely used for air quality and pollution applications. AOT imagery is recorded and updated daily at 6 km resolution.