Results
Hawassa IDZ
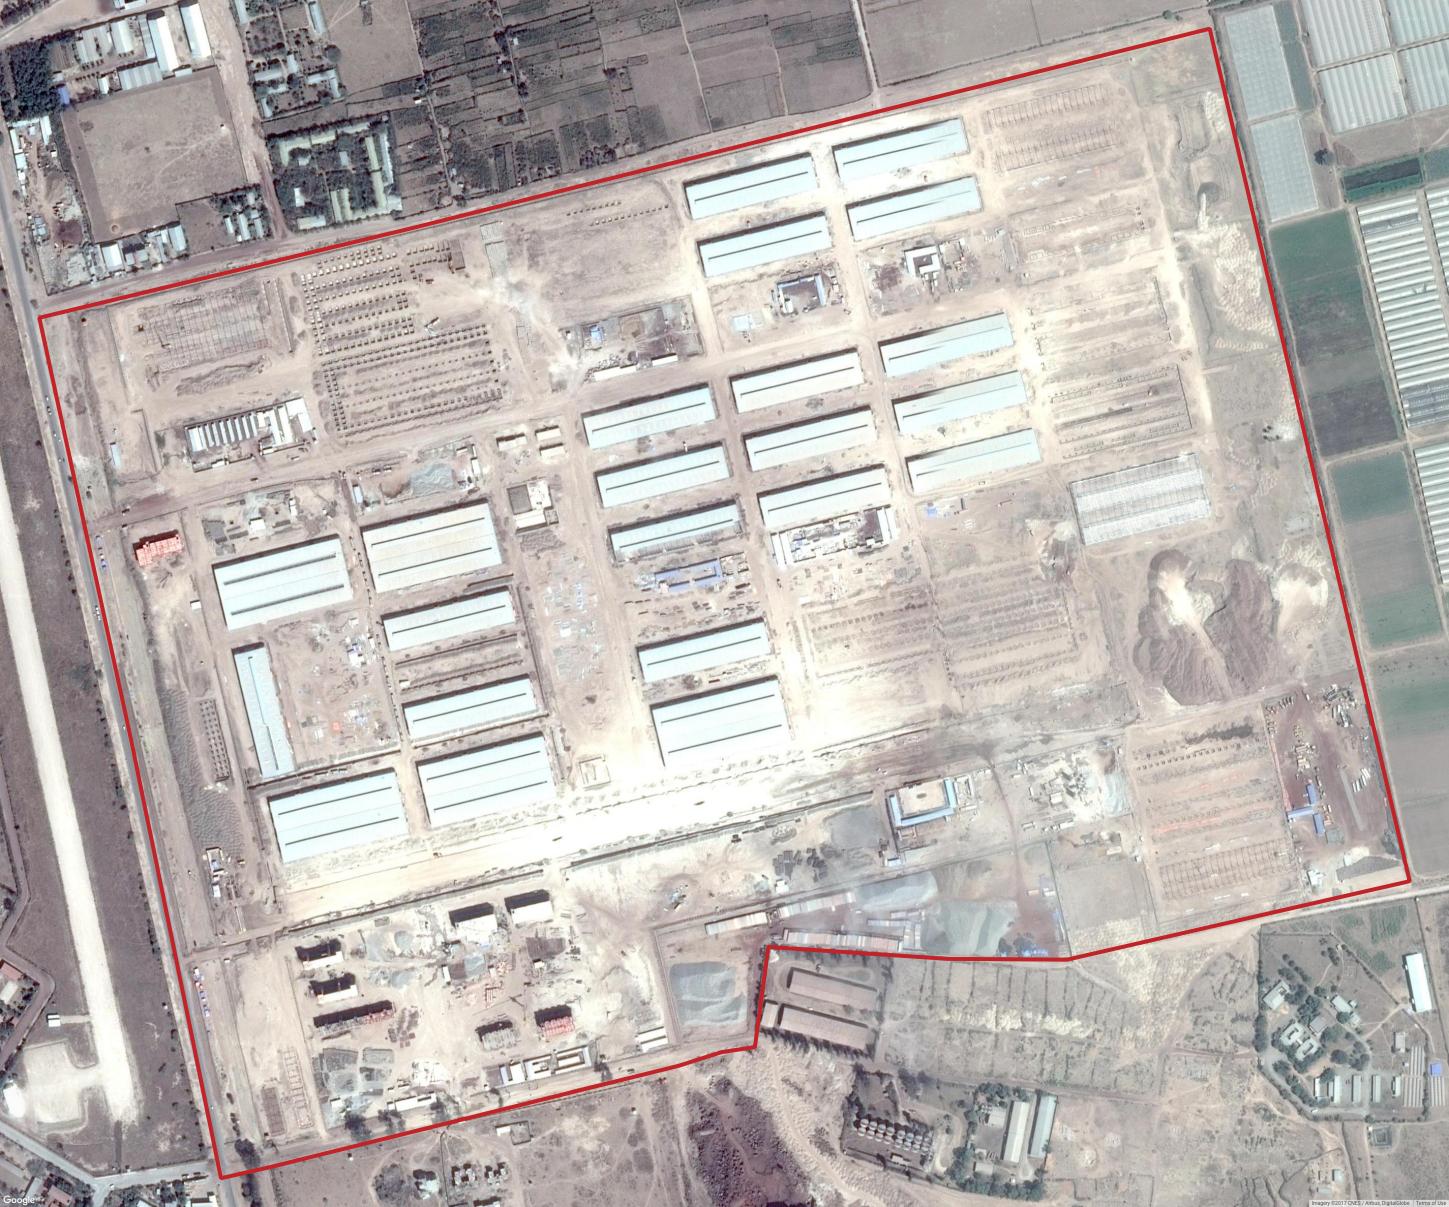
Hawassa IDZ in Ethiopia was established in 2015 as a USD 250 million investment. It spans across an area of 130 hectares (with plans to expand it to 300 hectares) with a focus on textiles, apparel manufacturing and agro-processing.
Unlike some of the other SEZs, Transport links are a major challenge to Hawassa, as the nearest port (Djibouti) is located 600 miles away. The Ethiopian government has so far been unsuccessful to secure funding for extensions from Hawassa Industrial Park to the existing motorway network, and the existing railway line from Addis Ababa to Djibouti.
However, one of the main reasons for investing in the region was the high number of labourers looking for better job prospects. Since opening in 2016, 52 units have been leased out to 18 major-manufacturing companies from China, Indonesia and the US. The recent arrival of PVH (a textile manufacturer which represents brands such as Calvin Klein and Tommy Hilfiger) has significantly increased investor confidence in the success of the park, but economic impact remains contentious in press coverage.
The Ethiopian Prime Minister Hailemariam Desalegn noted that “We want to sustain the grown of the manufacturing industry, as stipulated in our five-year Growth and Transformation Plan”. His promise includes the planning of 16 similar industrial parks throughout Ethiopia, with 60,000 jobs targeted.
- Size analyzed: 143 hectares
- Established: 2015
- Phase: Creation
Analysis
The stated targets for Hawassa have been relatively clearly stated as “sustained growth of the manufacturing industry” and to invigorate the region in terms of job prospects for the local population (5m people live in 50k of the site). However, the Hawassa site is distinct from most other SEZ - it is 300km south of the capital, and has relatively weak infrastructural links. Concern around this lack of attractiveness to foreign investment is the thus a key concern. But moreover its location means economic impact should not only be measured in terms of overall contribution to national economic macro-indicators such as GDP, but rather assessed against its effectiveness in reinvigorating of the local region itself.
Generation of 60k jobs were targeted, and these can be directly assessed via CDR data concerning unique account activity. Expansion of manufacturing capacity can be reflected via assessment of micro-indicators such as vehicle prevalence (extracted from EO imagery), electricity usage patterns and evolving land-use classification. Yet it is expansion/development of road infrastructure that would reflect significant success for this site. As our techniques show, this is readily detectable from EO imagery. Unfortunately our Phase I analysis also indicates that such infrastructure remains a key issue (despite some promising investment from US manufacturing companies seeking to leverage a cost-effective labour force).
Moreover, recent press coverage has highlighted potential downward pressure on wages due to a captive local work-force (see guardian 05 dec 2017) . This is of course conjecture, but compelling evidence on the impact on local wage growth is hard to obtain without relevant financial data/surveys. Proxies for wage attainment/income are likely not available even from CDR due to Ethiopia’s reticence as a nation to embrace mobile money to the same degree as nearby economies in East Africa (despite being the second most populous country on the continent and the recent expansion of M-BIRR). In contrast concern about reported power failures in the region ought be examinable via night lights-like EO imagery indicators - but further assessment would be required.
Land Classification
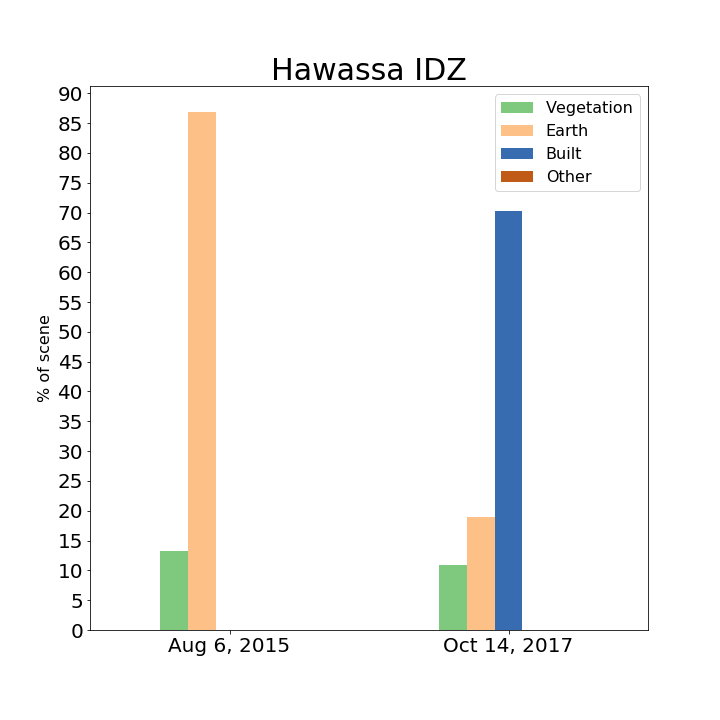
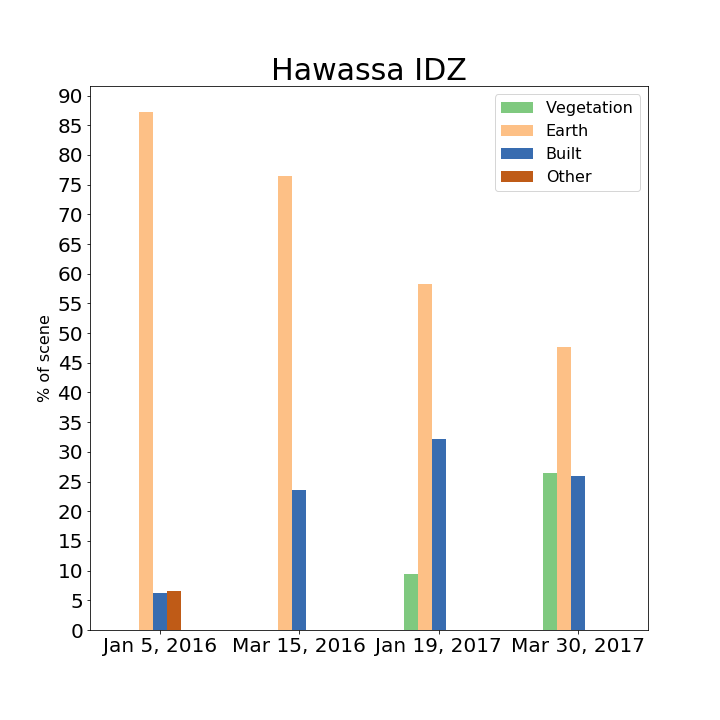
The two points in time used here represent the current life of the Hawassa zone, spanning from when it was established to the present. Here, the first image is mostly earth with some remaining vegetation. Then in the second image there are buildings, more or less uniform in color, with some lush green vegetation and some dirt/sand areas. This uniformity within classes makes this an easily clustered image.
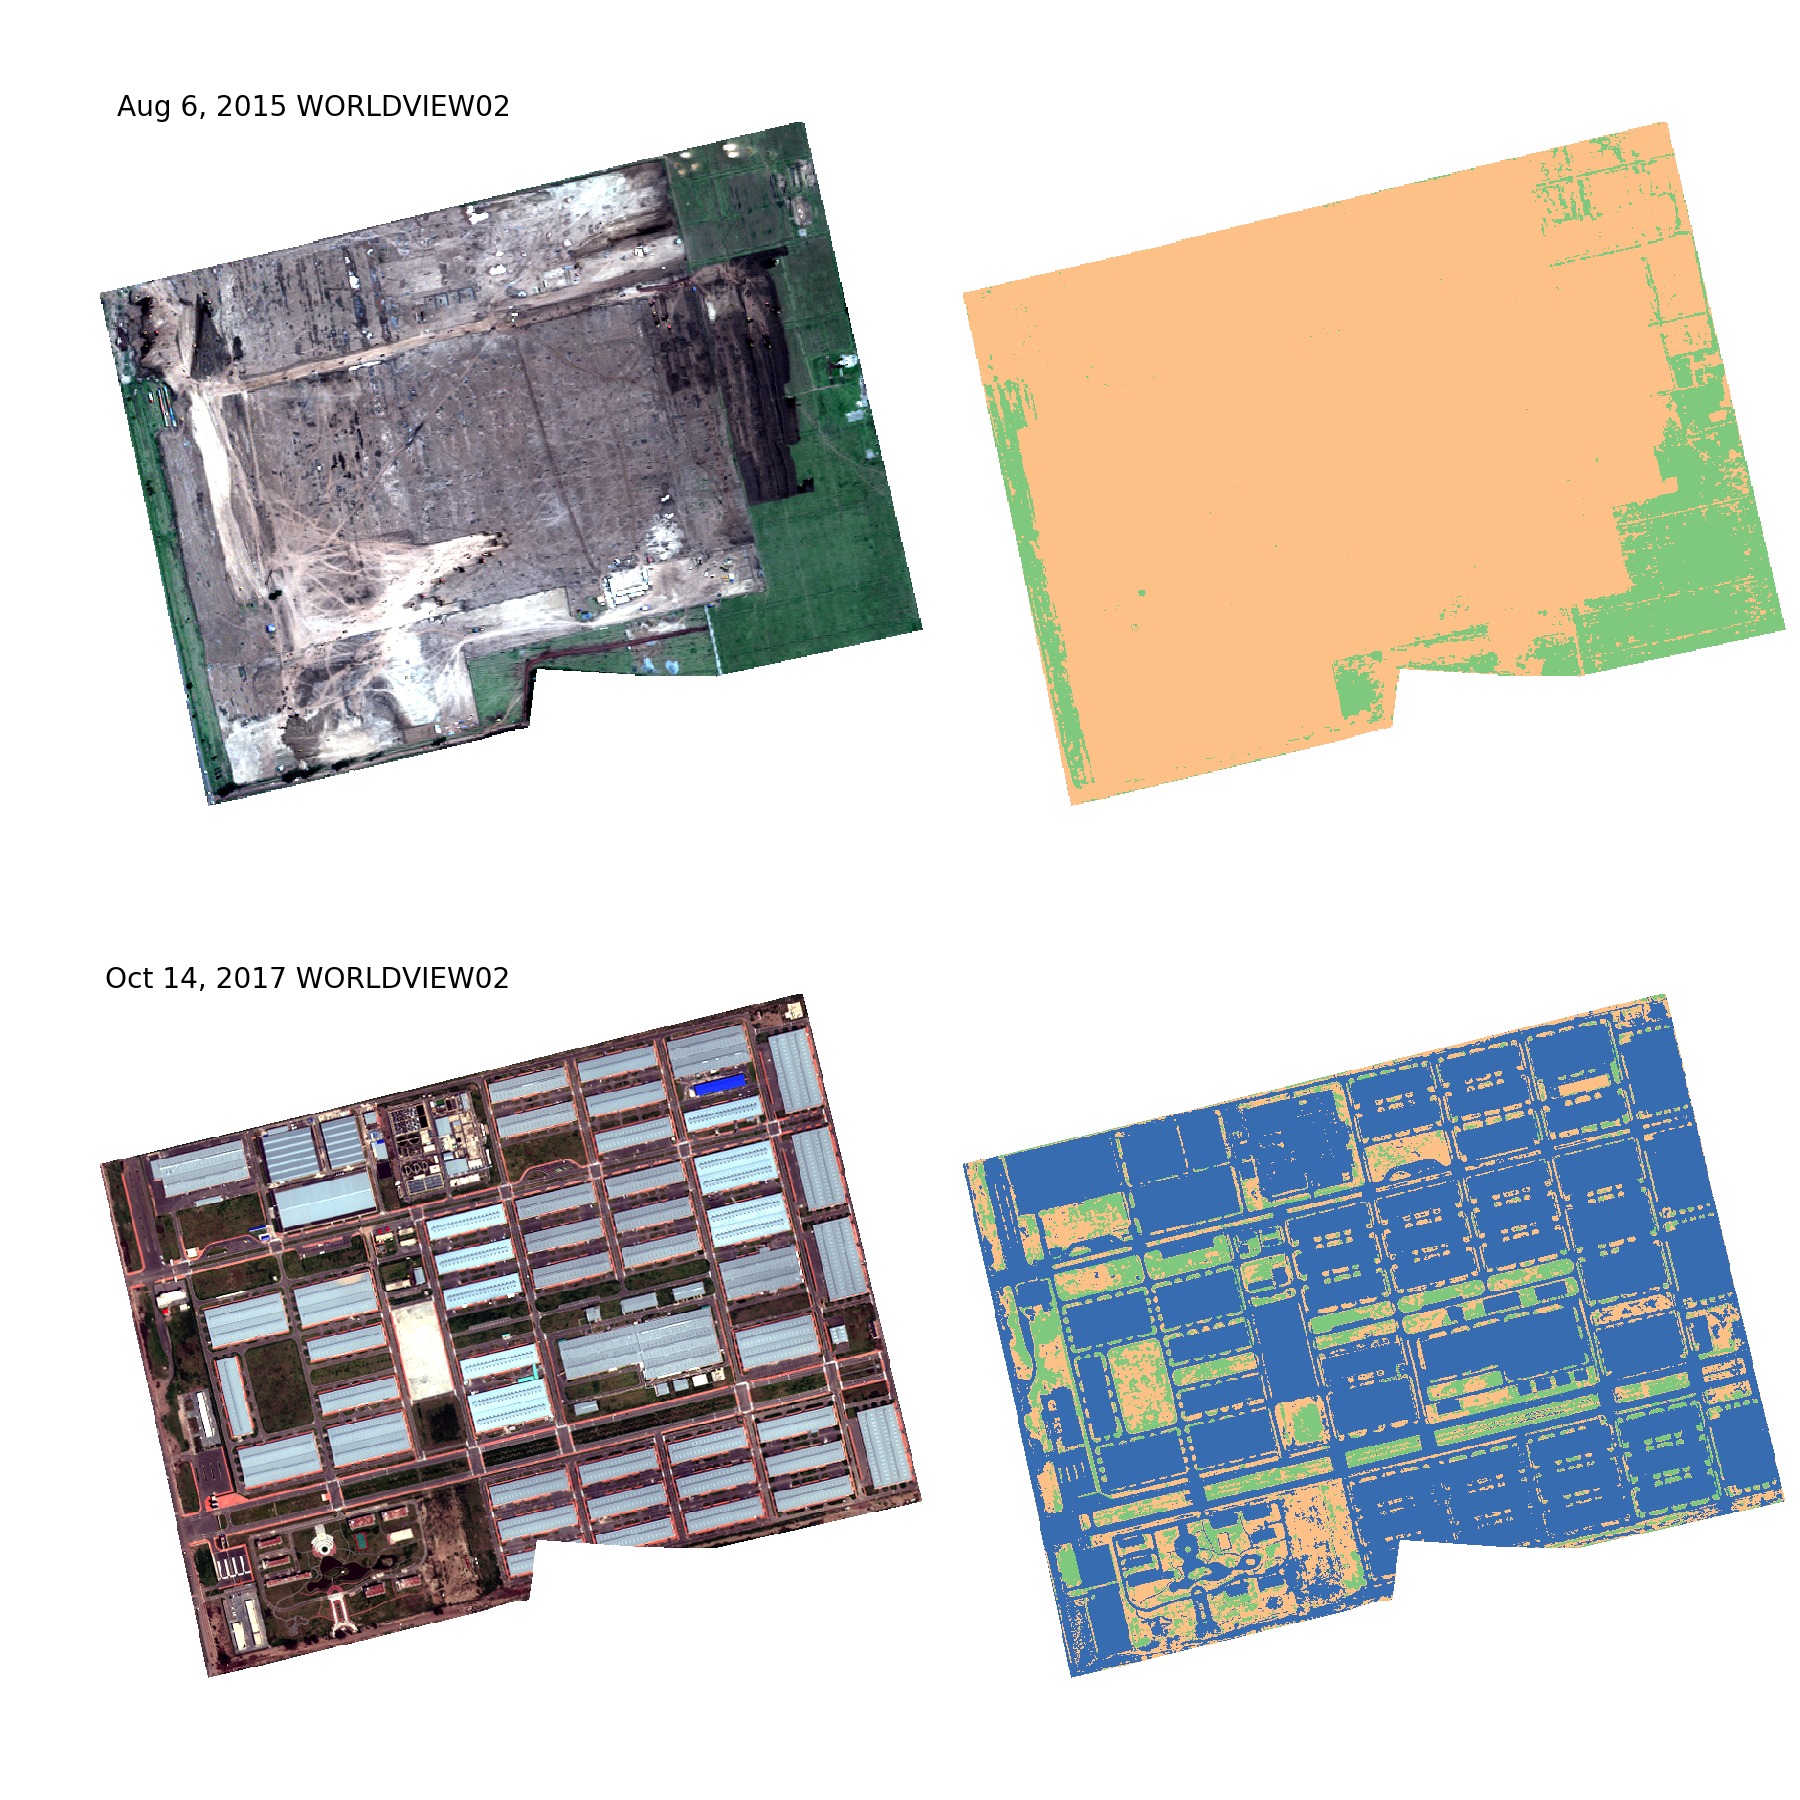
The resulting class percentages are an accurate representation of what can be seen visually above.
Sentinel-2 Land Classification
Because of the short time period of development, and the fact that it was recent, makes it a good case for using Sentinel-2 data. While the resolution is far worse, it has a revisit rate of 10 days for every zone location. It is ideal for seeing these short term changes. Below there are 4 images spanning 1 year and 4 months. Lots of misclassification can be seen, especially in the last image where vegetation covers larger areas than it should. Part of this problem may be the SWIR bands that were used in the clustering, which are lower resolution and can be cause of some of the blockiness.
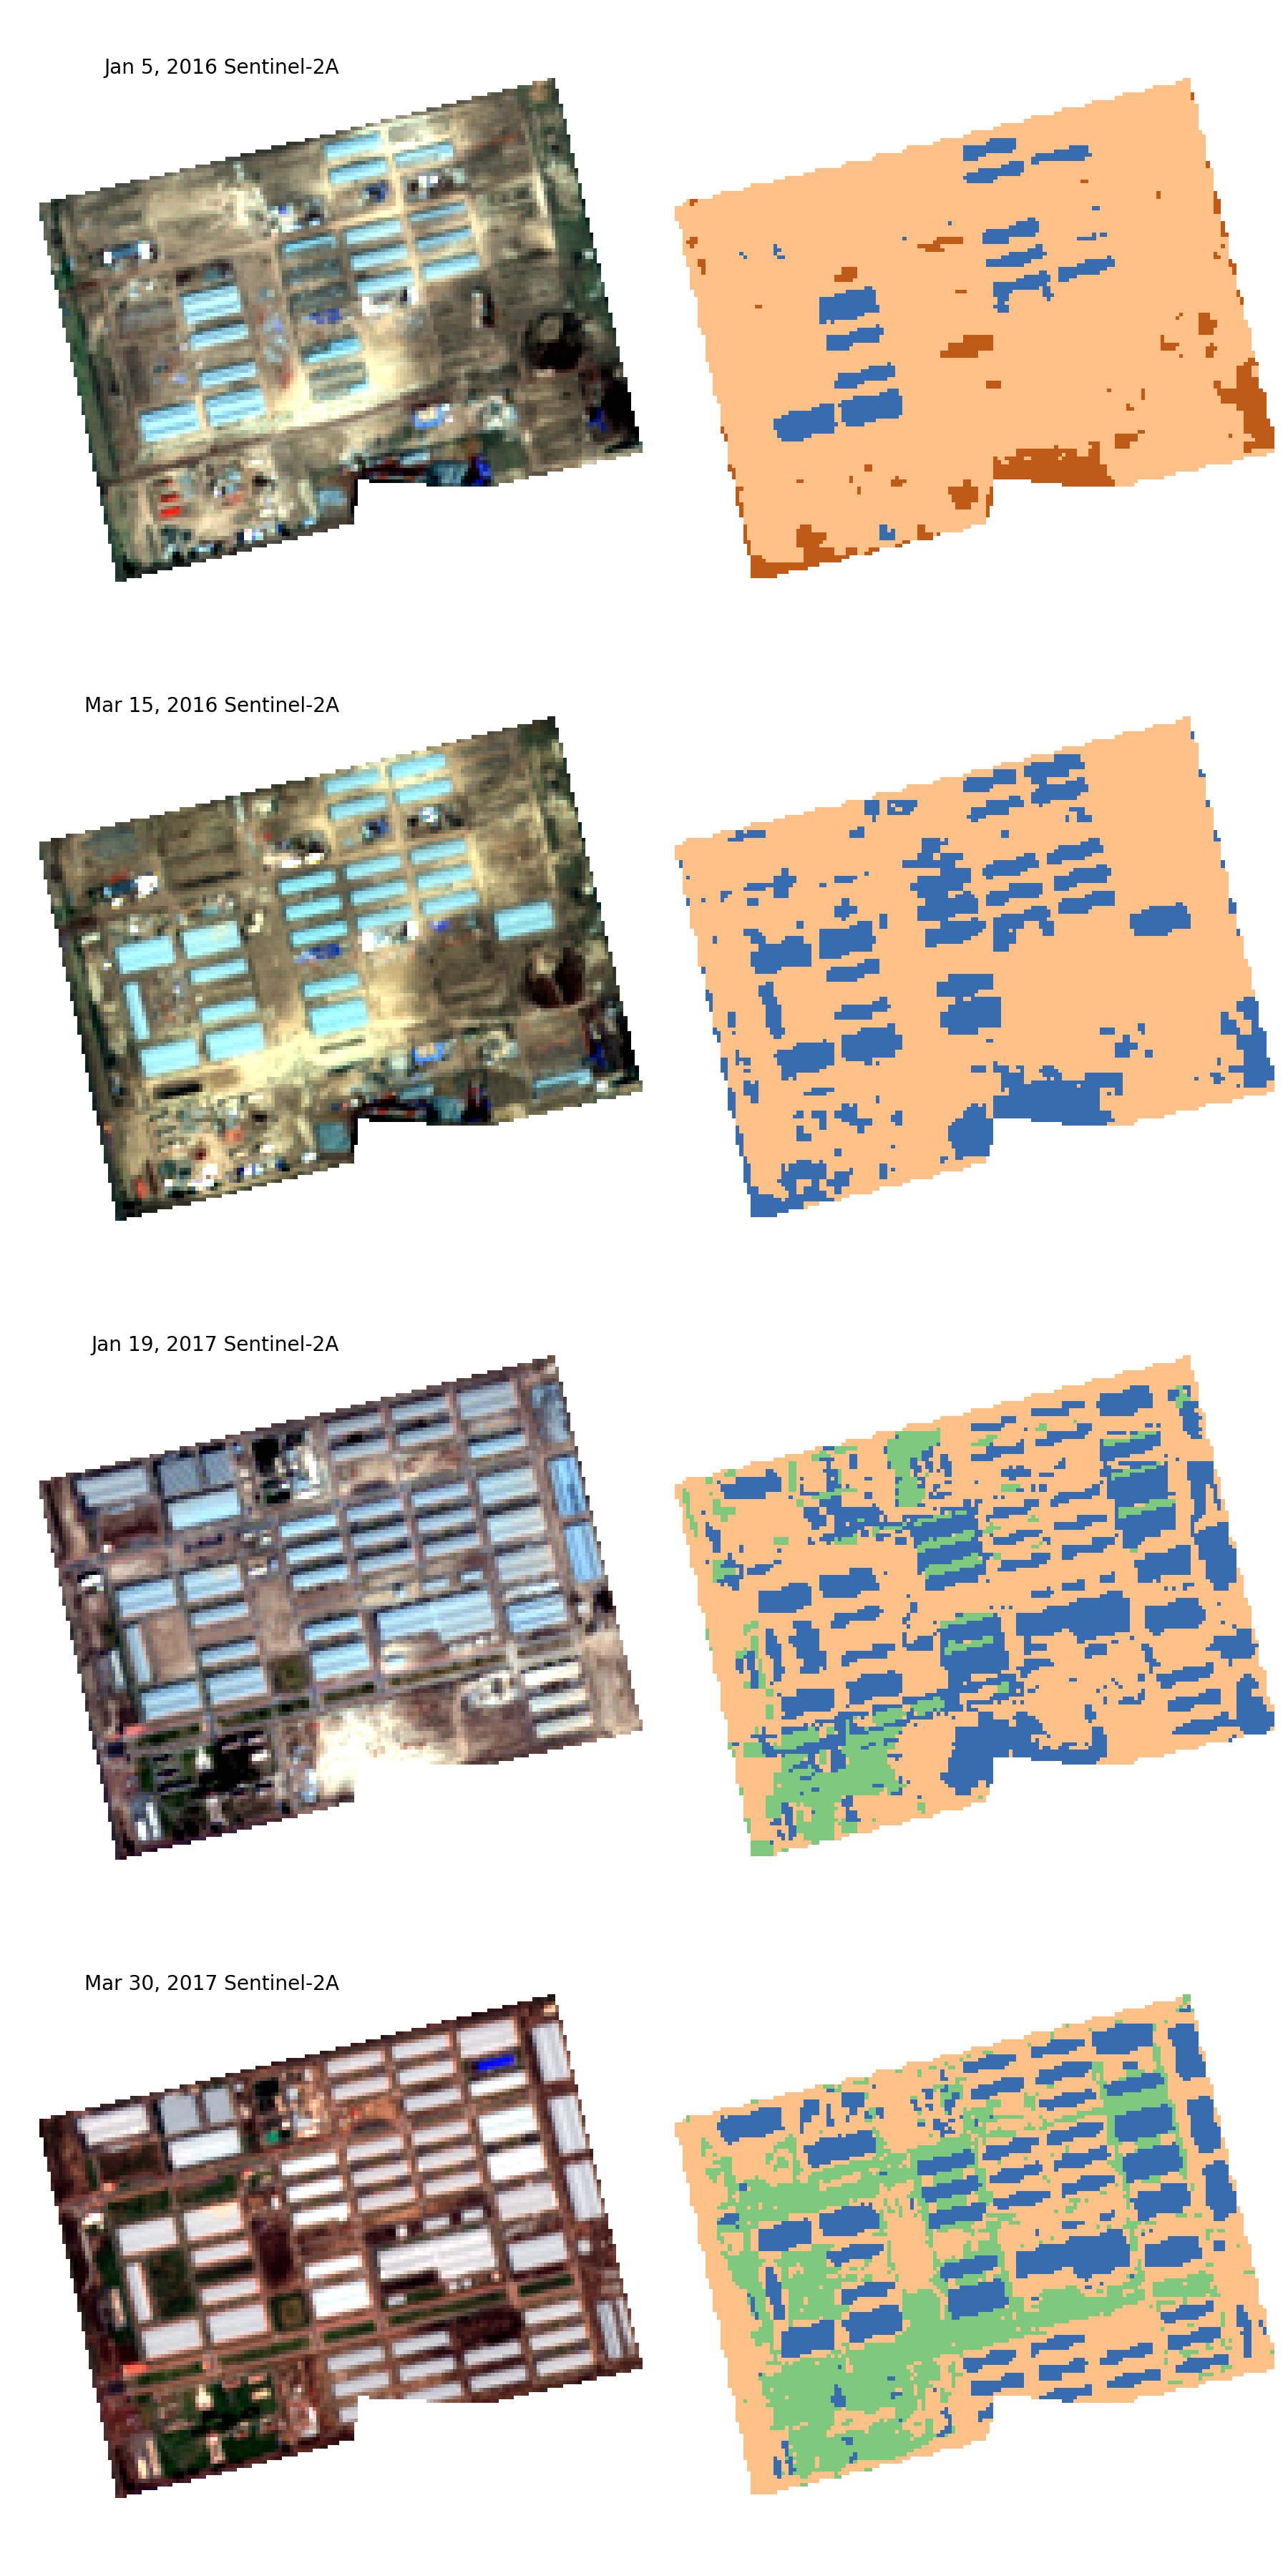
The overall percentages over time are reasonable and are verified with a visual inspection. Still, error can be seen in the last image where there is an apparent decrease in built area rather than a small increase like it should be.
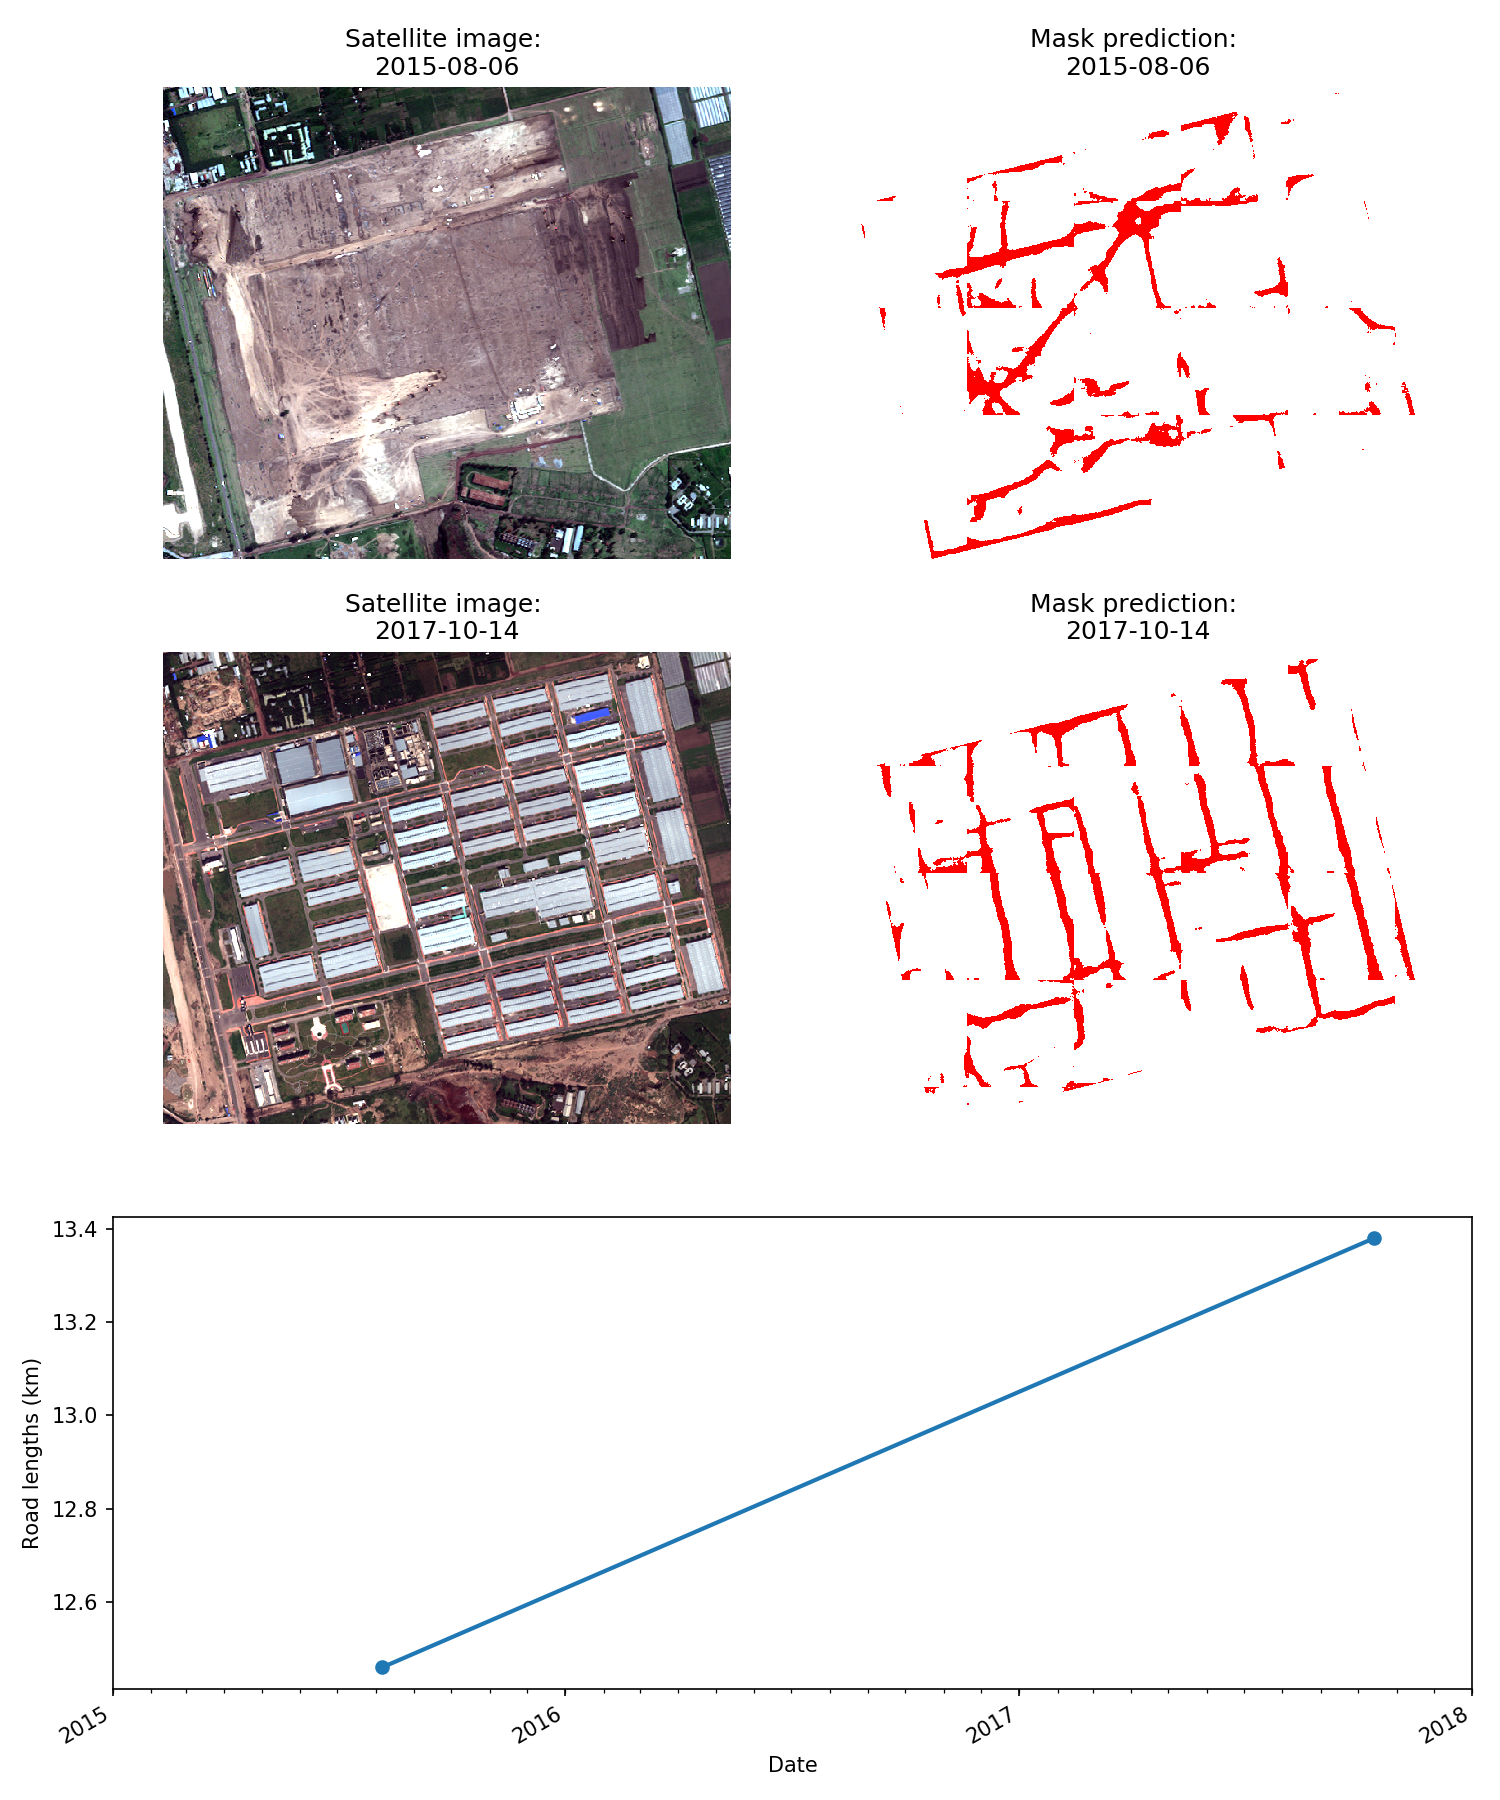
Transport Infrastructure
The total length of roadway (in km) was calculated using imagery from Digital Globe's Worldview-02 satellite. Here, Skynet gives a reasonable road mask.
Note that detected roadway decreases despite development. It seems that the model is confused by small dirt roads and tracks that are being removed as the zone develops. In the future, we may want to distinguish paved roadway from dirt roads and tracks when calculating this indicator.
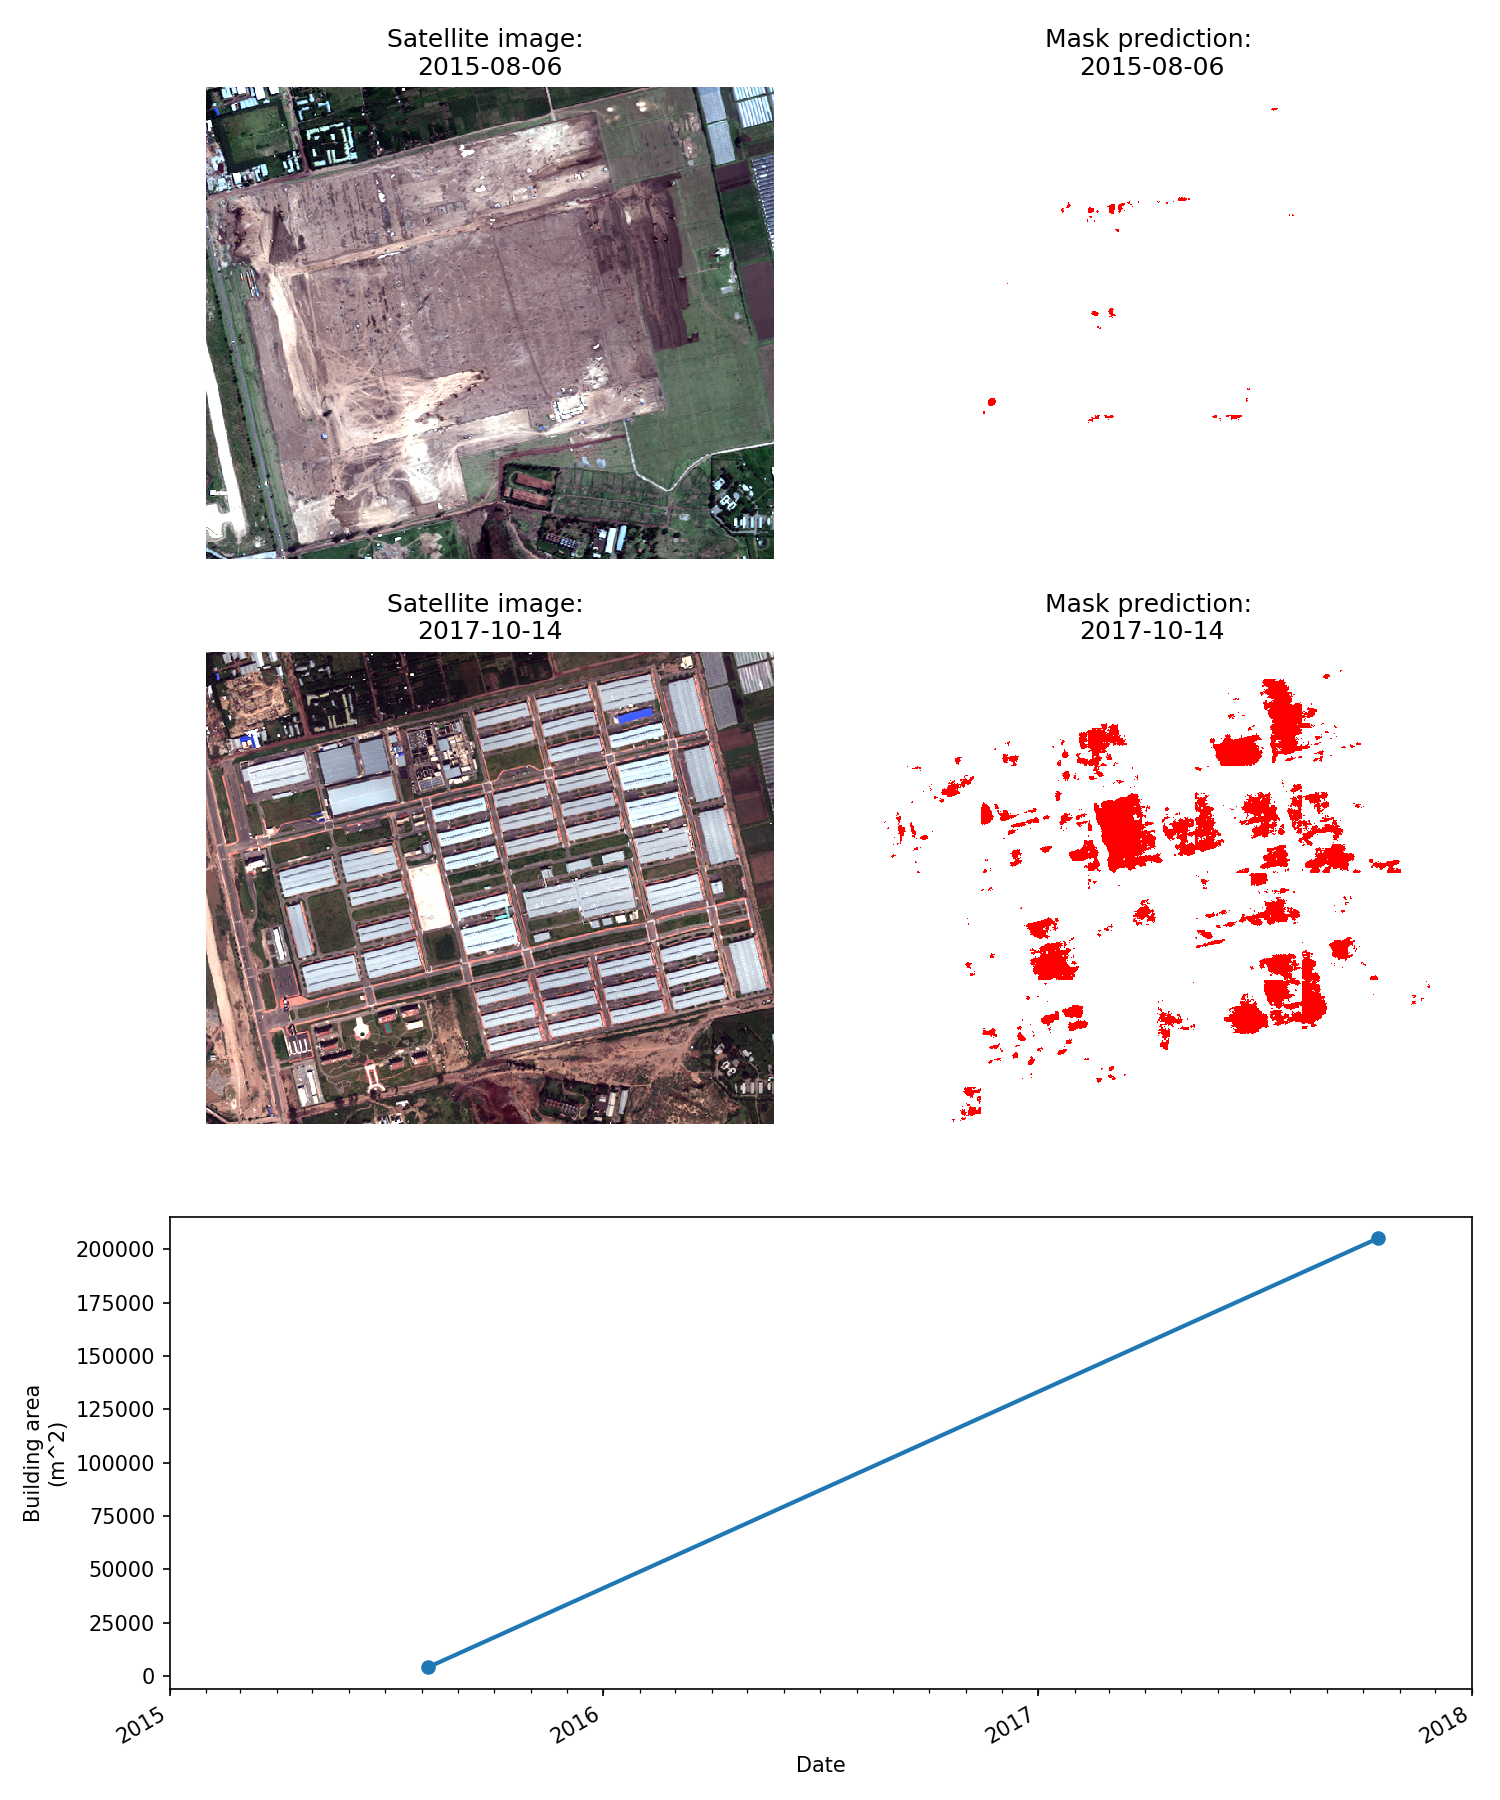
Building Footprints
The total building area (in m^2) was calculated using imagery from Digital Globe's Worldview-02 satellite. Here, Skynet gives a reasonable estimate of building footprint and correctly predicts a great deal of development. As in some other scenes, it provides a conservative estimate in that some buildings are missed but predicts few false positives.
Building Counts
Two image scenes from Worldview, Aug. 2015 and Oct. 2017, were used to test over our object detection neural net. Hawassa IDZ was established in 2015, and the whole site was under construction. Our model was able to detect two buildings in 2015, but 53 buildings were detected from 2017 Worldview imagery.

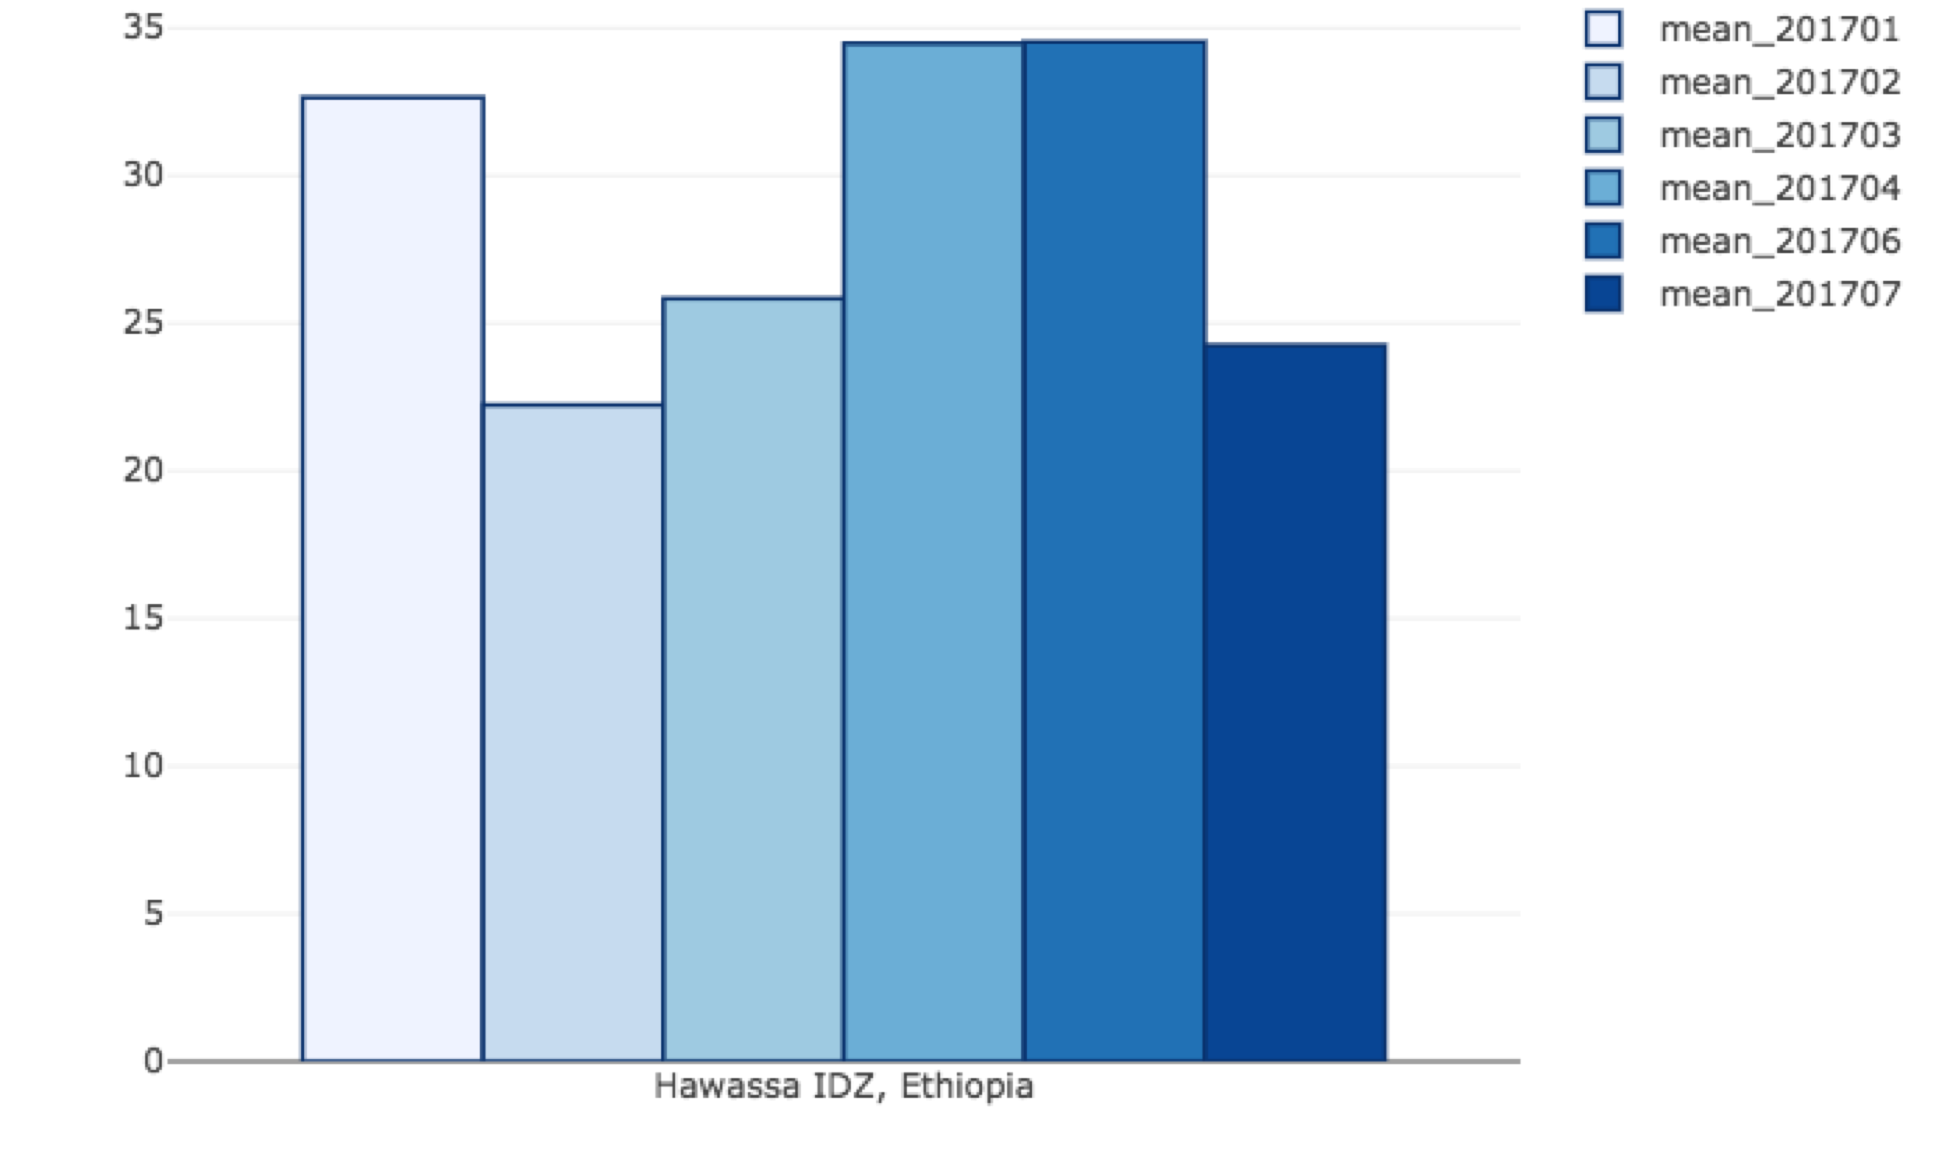
Electricity Consumption
Electricity consumption is highly correlated to a region's economic activity. To estimate electricity consumption, we used the Visible Imaging Radiometer Suite (VIIRS) Day/Night Band (DNB) imagery to correlate nighttime light radiance. Specifically, monthly VIIRS DNB product from The Earth Observations Group (EOG) at NOAA/NGDC was used.
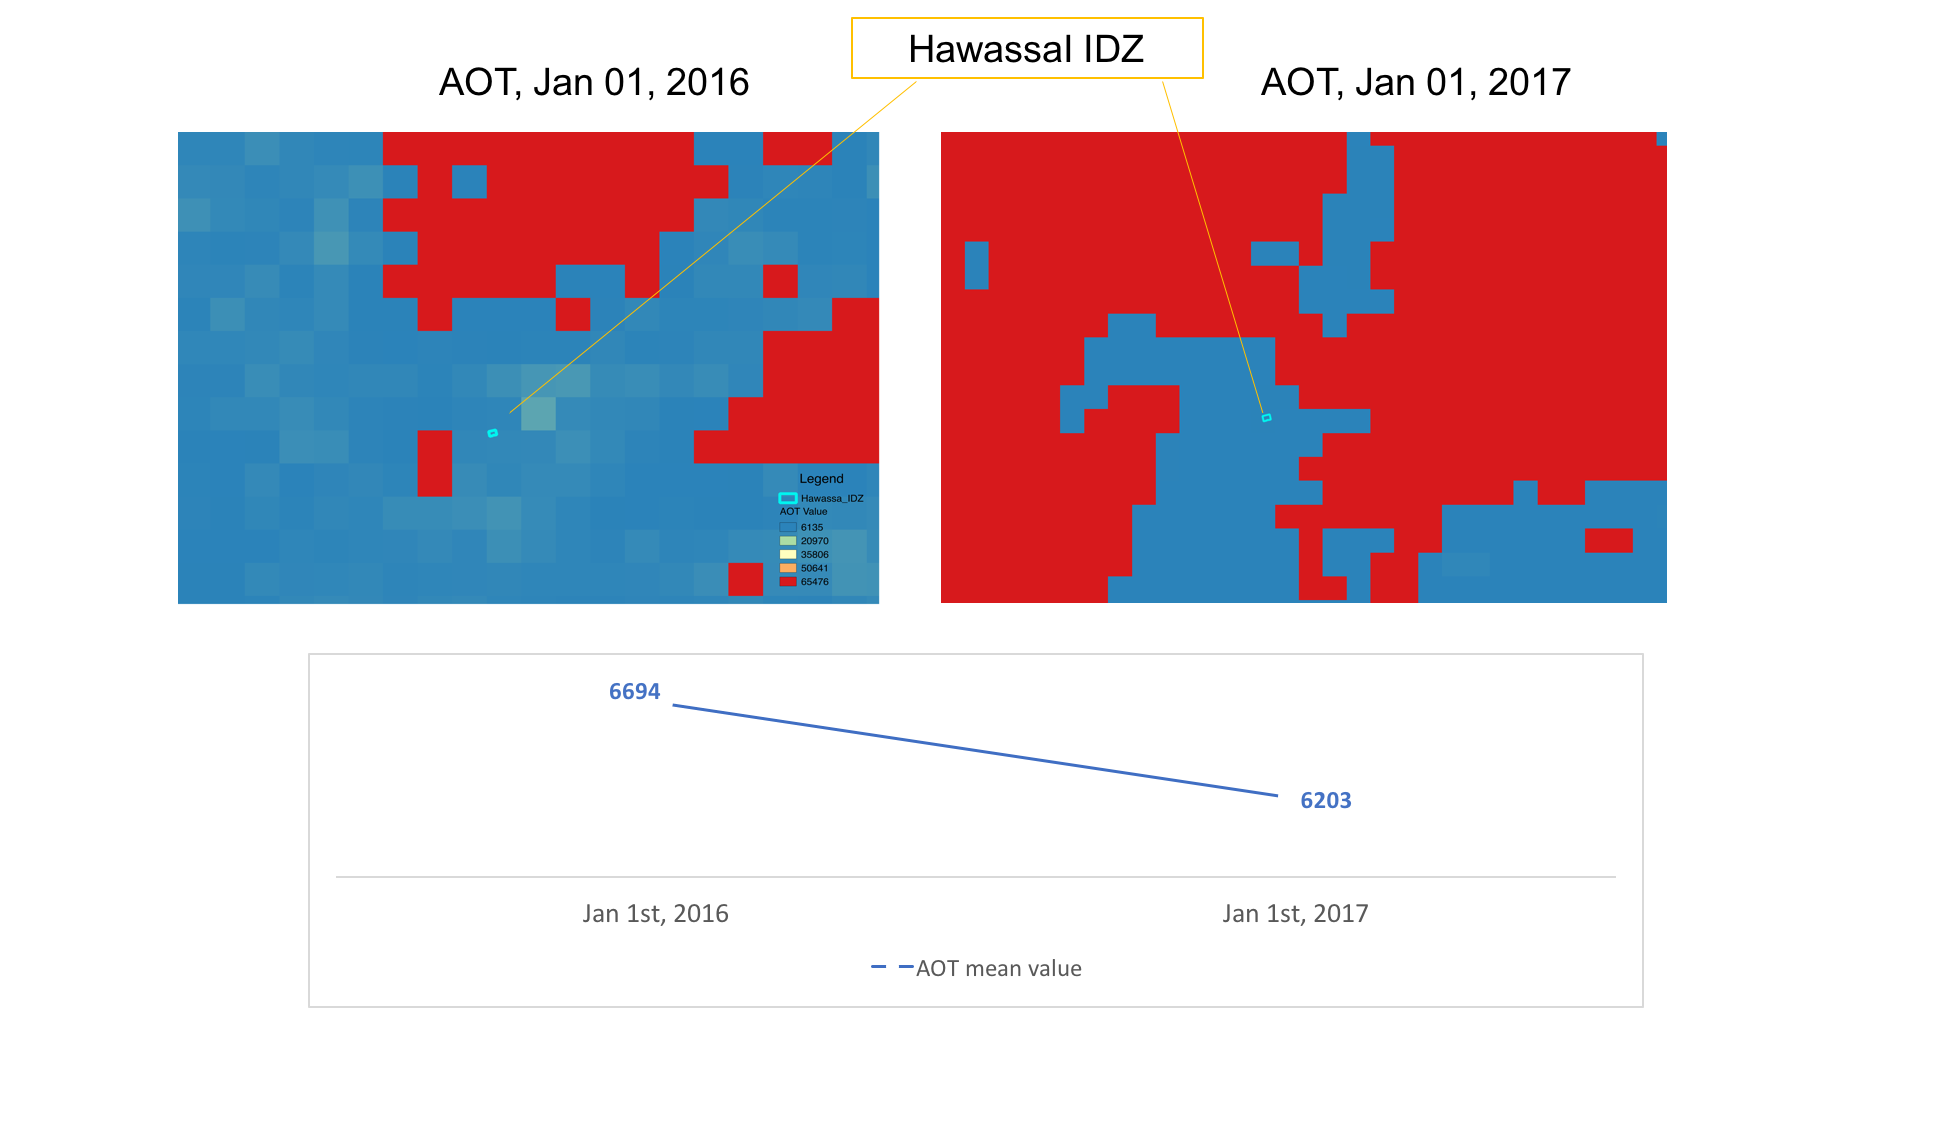
Pollution
Air quality and air pollution can also be monitored through VIIRS satellite imagery. Aerosol optical thickness (AOT) of VIIRS was obtained and processed as a proxy for air pollution indicator. Because it is related to the particulate matter, e.g. PM2.5, concentrations in the atmosphere, AOT is widely used for air quality and pollution applications. AOT imagery is recorded and updated daily at 6 km resolution.