Results
Hoa Khanh IZ
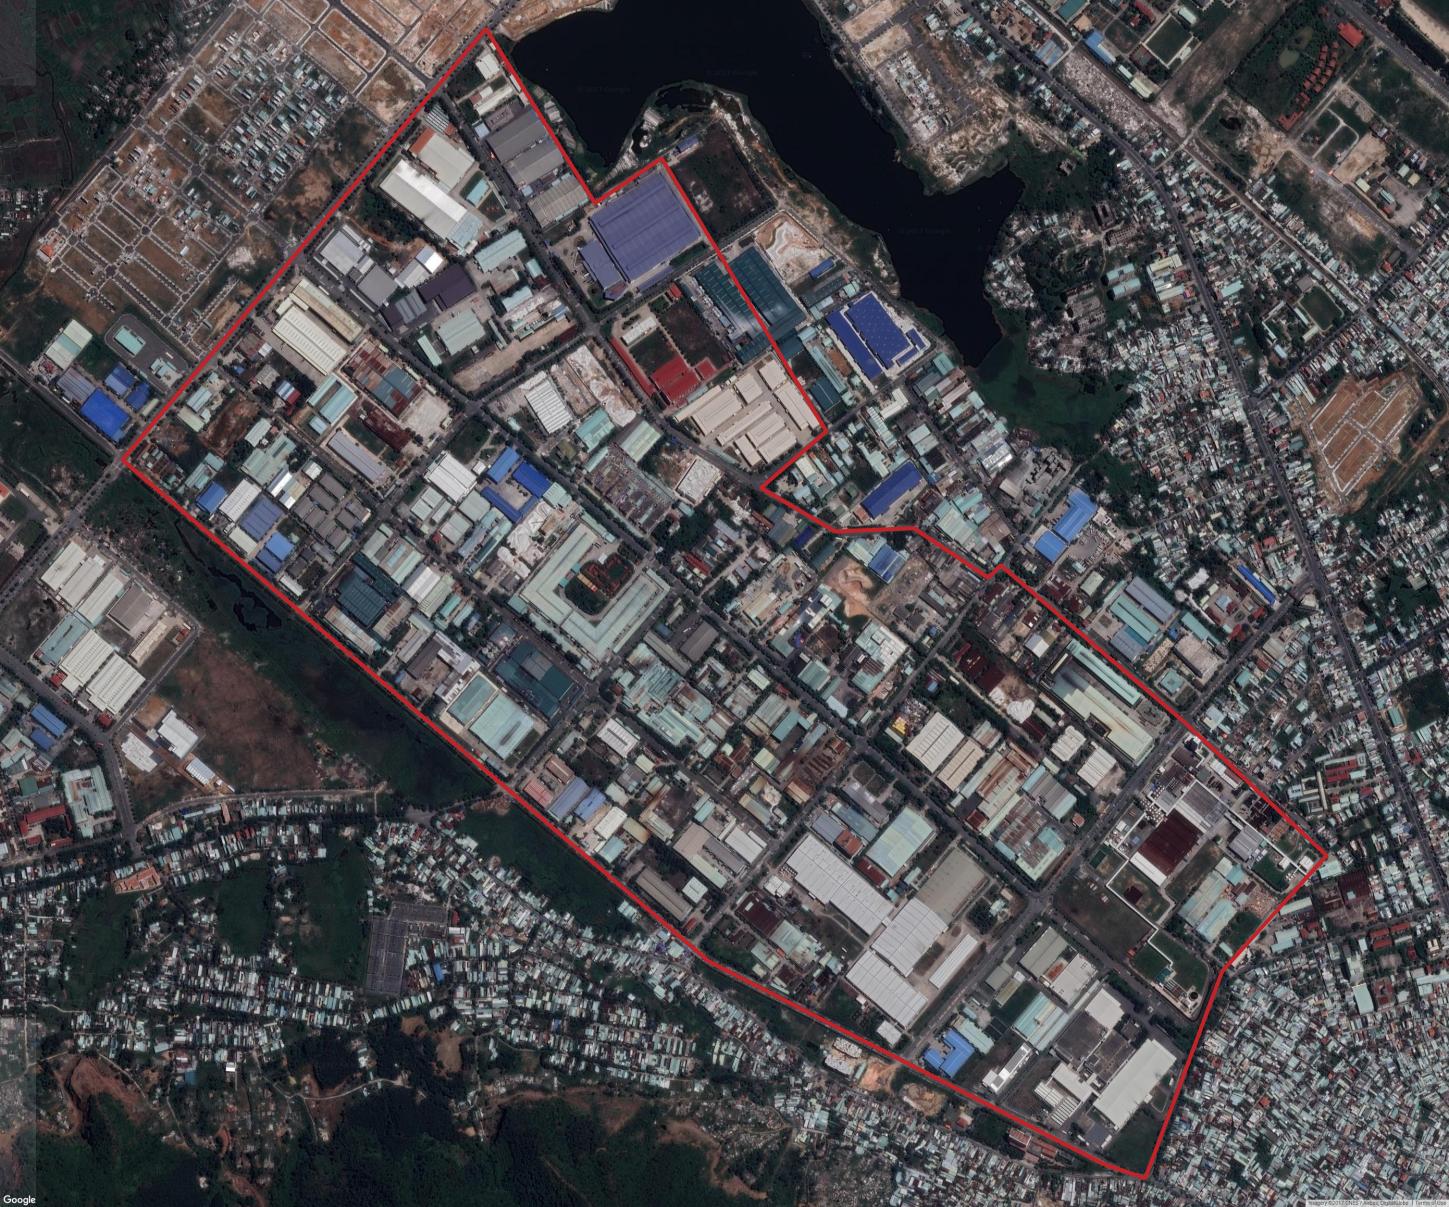
Hoa Khanh Industrial zone covers an area of 132.6 hectares. It is located along national highway 1A and close to Tien Sa Port and the East-West corridor linking Vietnam, Laos, Thailand and other Nations. The IZ houses around 20 projects by 16 companies with a main focus on garment, and high-tech electronics industry.
The aim of this SEZ was to reinvigorate the local economy of da Nang, the Vietnamese coastal city to which the industrial zone is attached. Economic indicators for the region, however, report sluggish economic response - with many areas of the zone remaining underdeveloped.
A lack of direct foreign investment, and a lack of infrastructural improvements may be a cause of this - however, in addition issues exist around “poor supportive industries and materials, a poorly trained labor force, high transport fees and limited locations” that are believed to have hindered foreign investors from being lured to the site.
The Vietnamese Deputy Minister of Planning and Investment, Van Trung, recently announced plans to develop 3 special administrative economic units, but none were attached to this site.
- Size analyzed: 280 hectares
- Established: 2000
- Phase: Operational
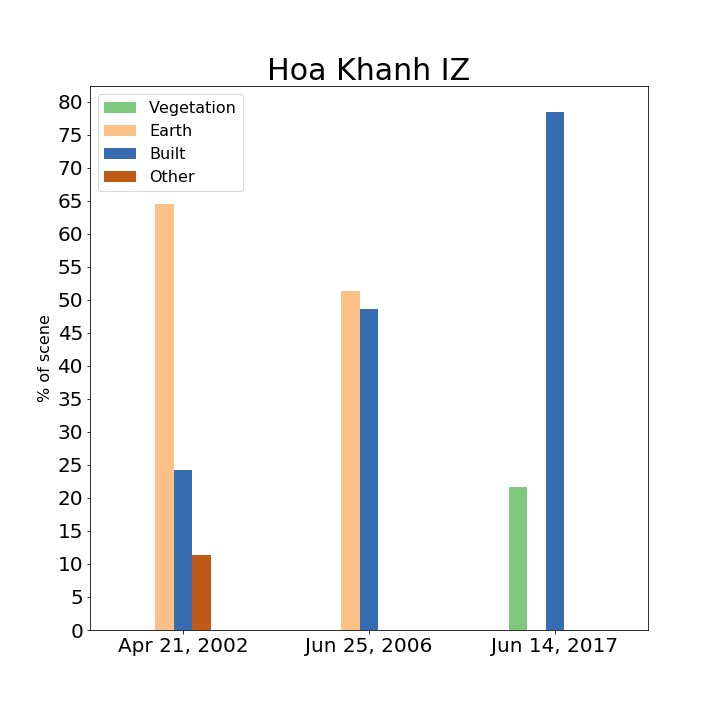
As can be seen in our Phase I results,EO imagery exists across the whole of this site’s duration. Land classification analysis of this site echoes that of most economic zones, in that most development occurs within the first 5 years of a site’s establishment. Here vegetation has actually recovered, with 80% of the site estimated to be covered with industrial footprint - interestingly for this site electricity, consumption estimates (inferred via VIIRS data) shows the well hypothesized correlation between a region’s economic activity and increase in electricity usage. This is likely due to the fact that the ideal span of the imagery, and hence timespan of the analysis, fits appositely with the site’s development phase - for this sort of analysis use of timely datasets from this period is crucial. However, what analysis of the site alone cannot show is the actually activity in the lots/building, many of which have been reported as under-used. Here CDR data to show actual activity would have been invaluable to support anecdotal evidence (“I have seen many land lots left underdeveloped” - Koichi Akiyama, general Director of Kane-M Da Nang company) and the fact that in 2015 a 30% drop in investment was recorded. Nor can it detect manufacturing flow in and out of the site, which commentary indicates are lower than was hoped. It is of course, difficult to unpick the causes of a site that is struggling, but poor infrastructure investment is widely quoted for this site. While road analysis shows a decrease in capacity, it is assessment of surrounding infrastructure (and the lack of development therein) that will be able to evidence this claim. Similarly director of the city’s investment promotion centre noted that the city was yet to see an investment breakthrough. A lack of foreign direct investment is also a concern, but many international SMEs unable to apply due to low capital investment. Assessment of international network activity is a relatively straightforward way of assessing the extent of this affect. A wider analysis of the city, external to this site over its lifetime would be necessary in Phase II, if only to show the anatomy of an SEZ that may not have met its full potential.
Land Classification
The images used here span most of the life of the zone: 2002, 2006, and 2017. In 2002 it was largely just earth, and most of the development can be seen in the first 6 years. Between 2006 and 2017 the area filled nearly completely with buildings with the remaining area converted into green space.
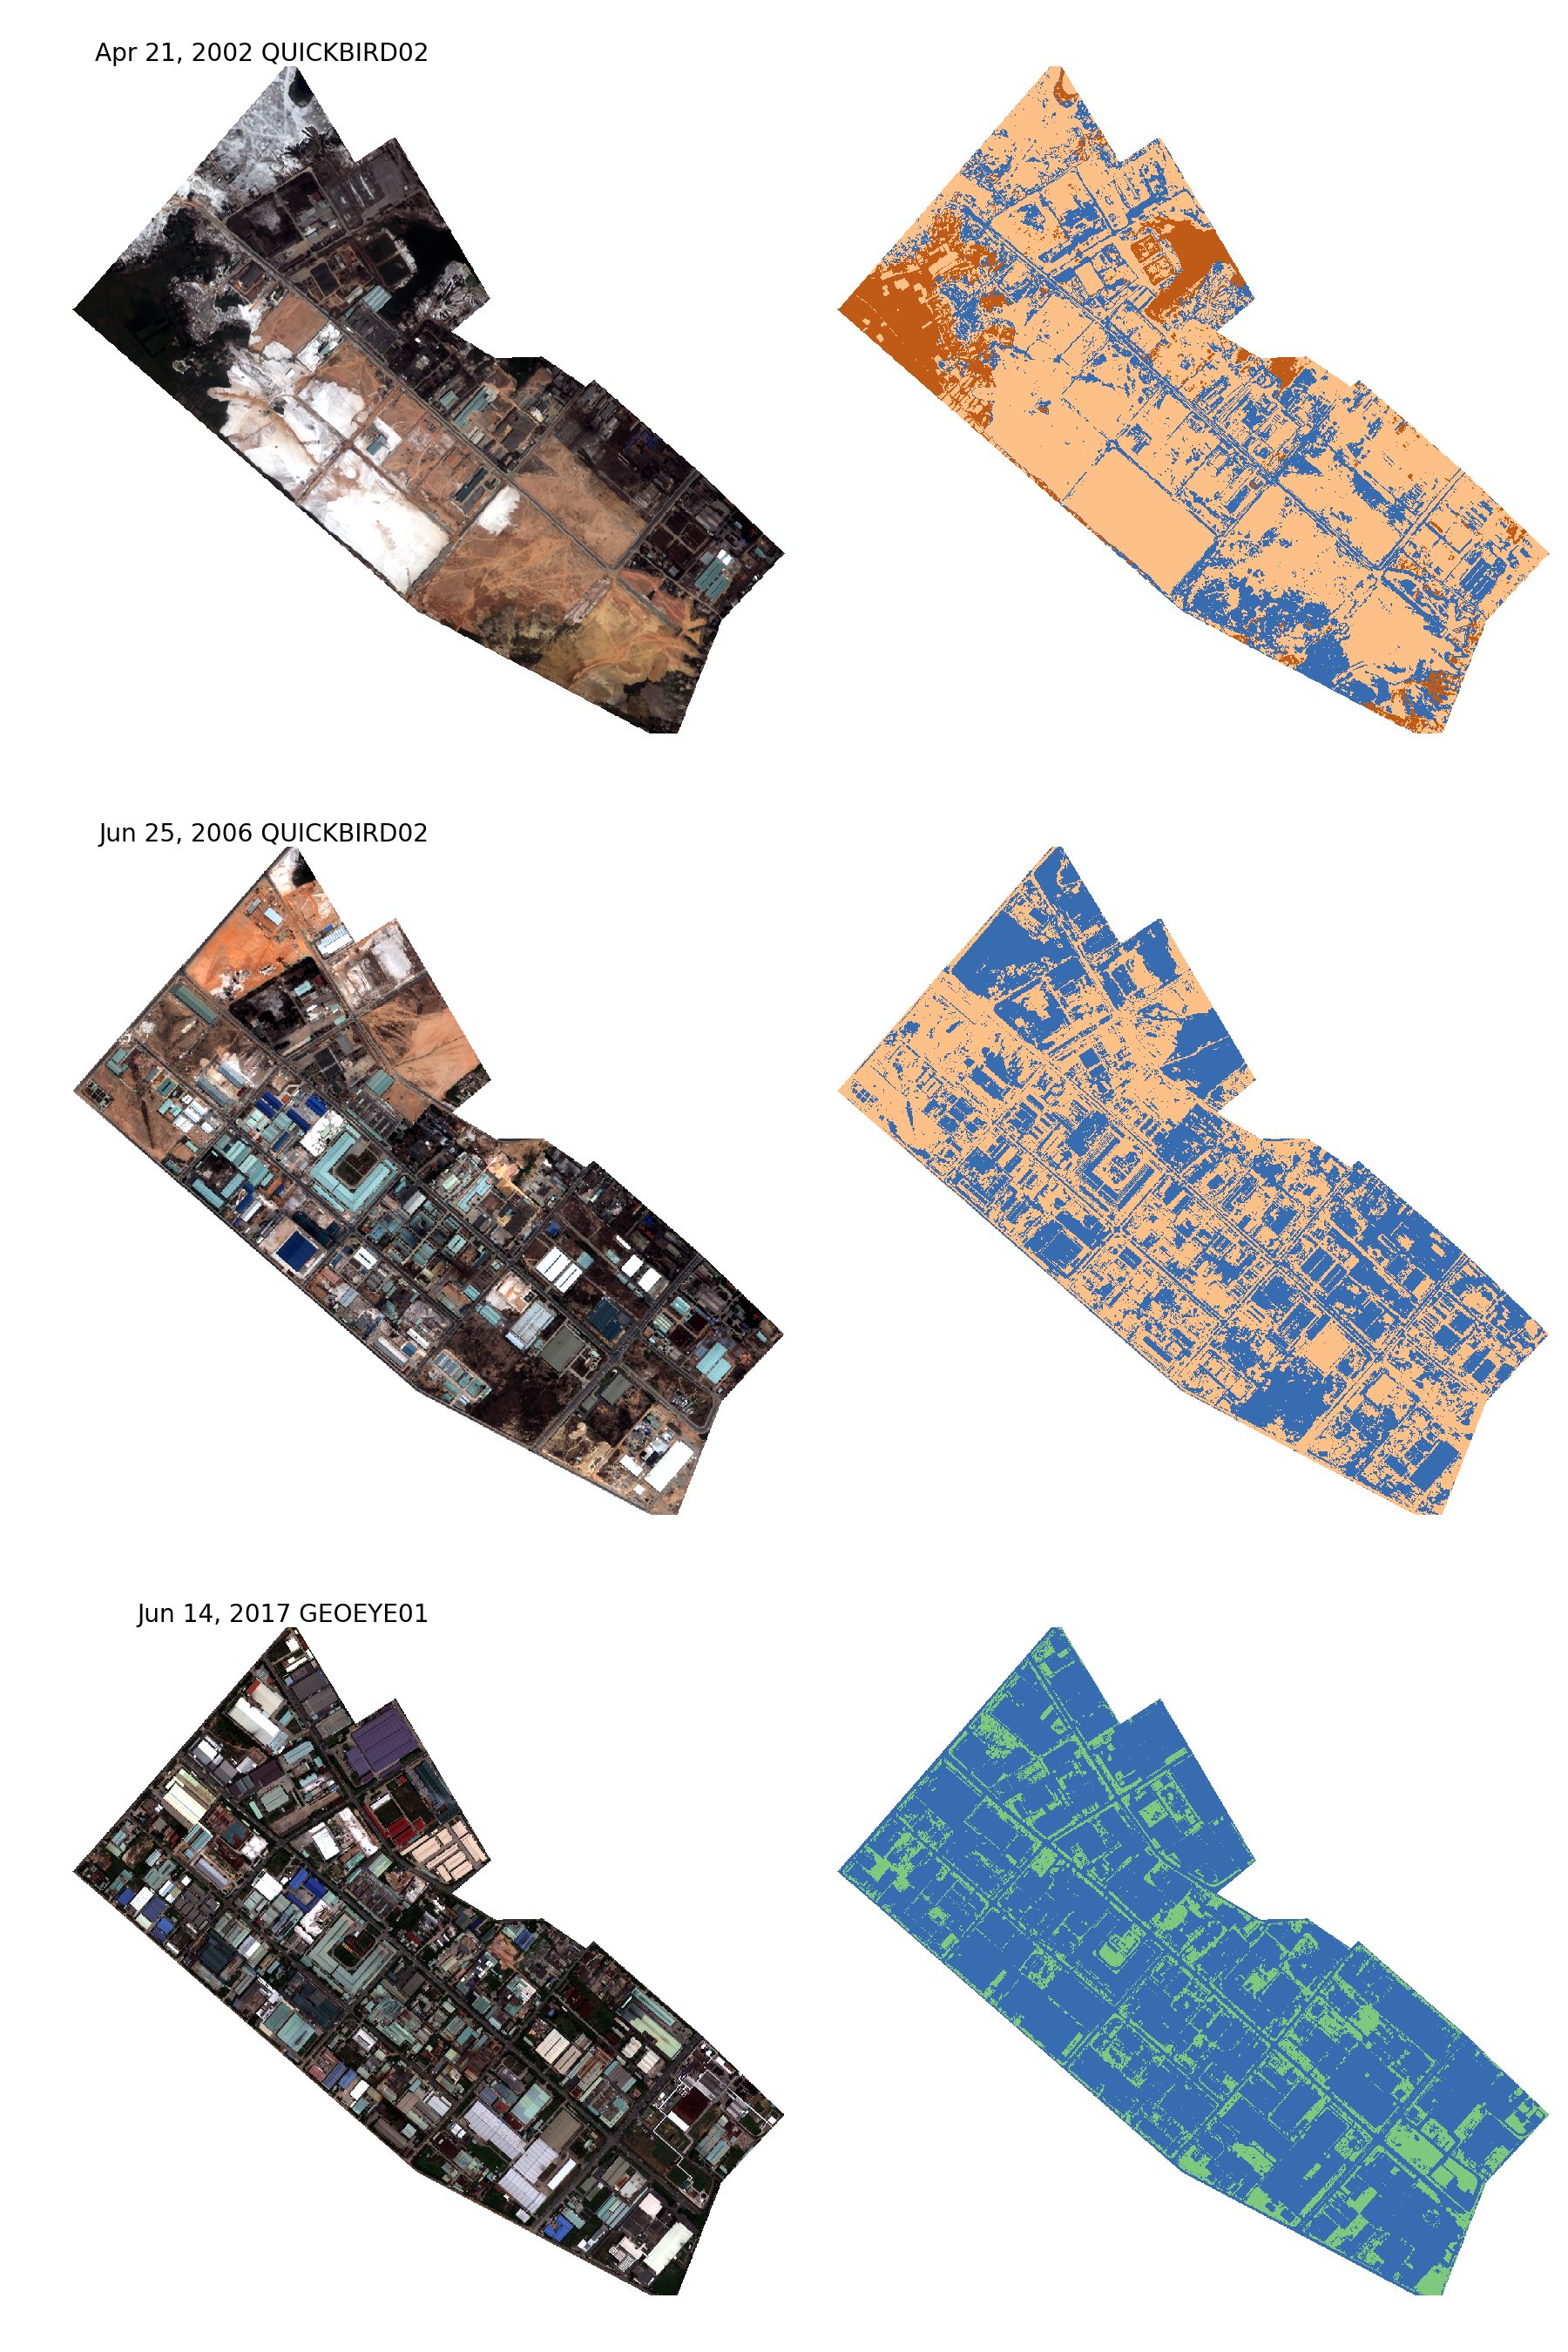
The percentages for land-use calculated are an excellent approximation of the actual land use.
Transport Infrastructure
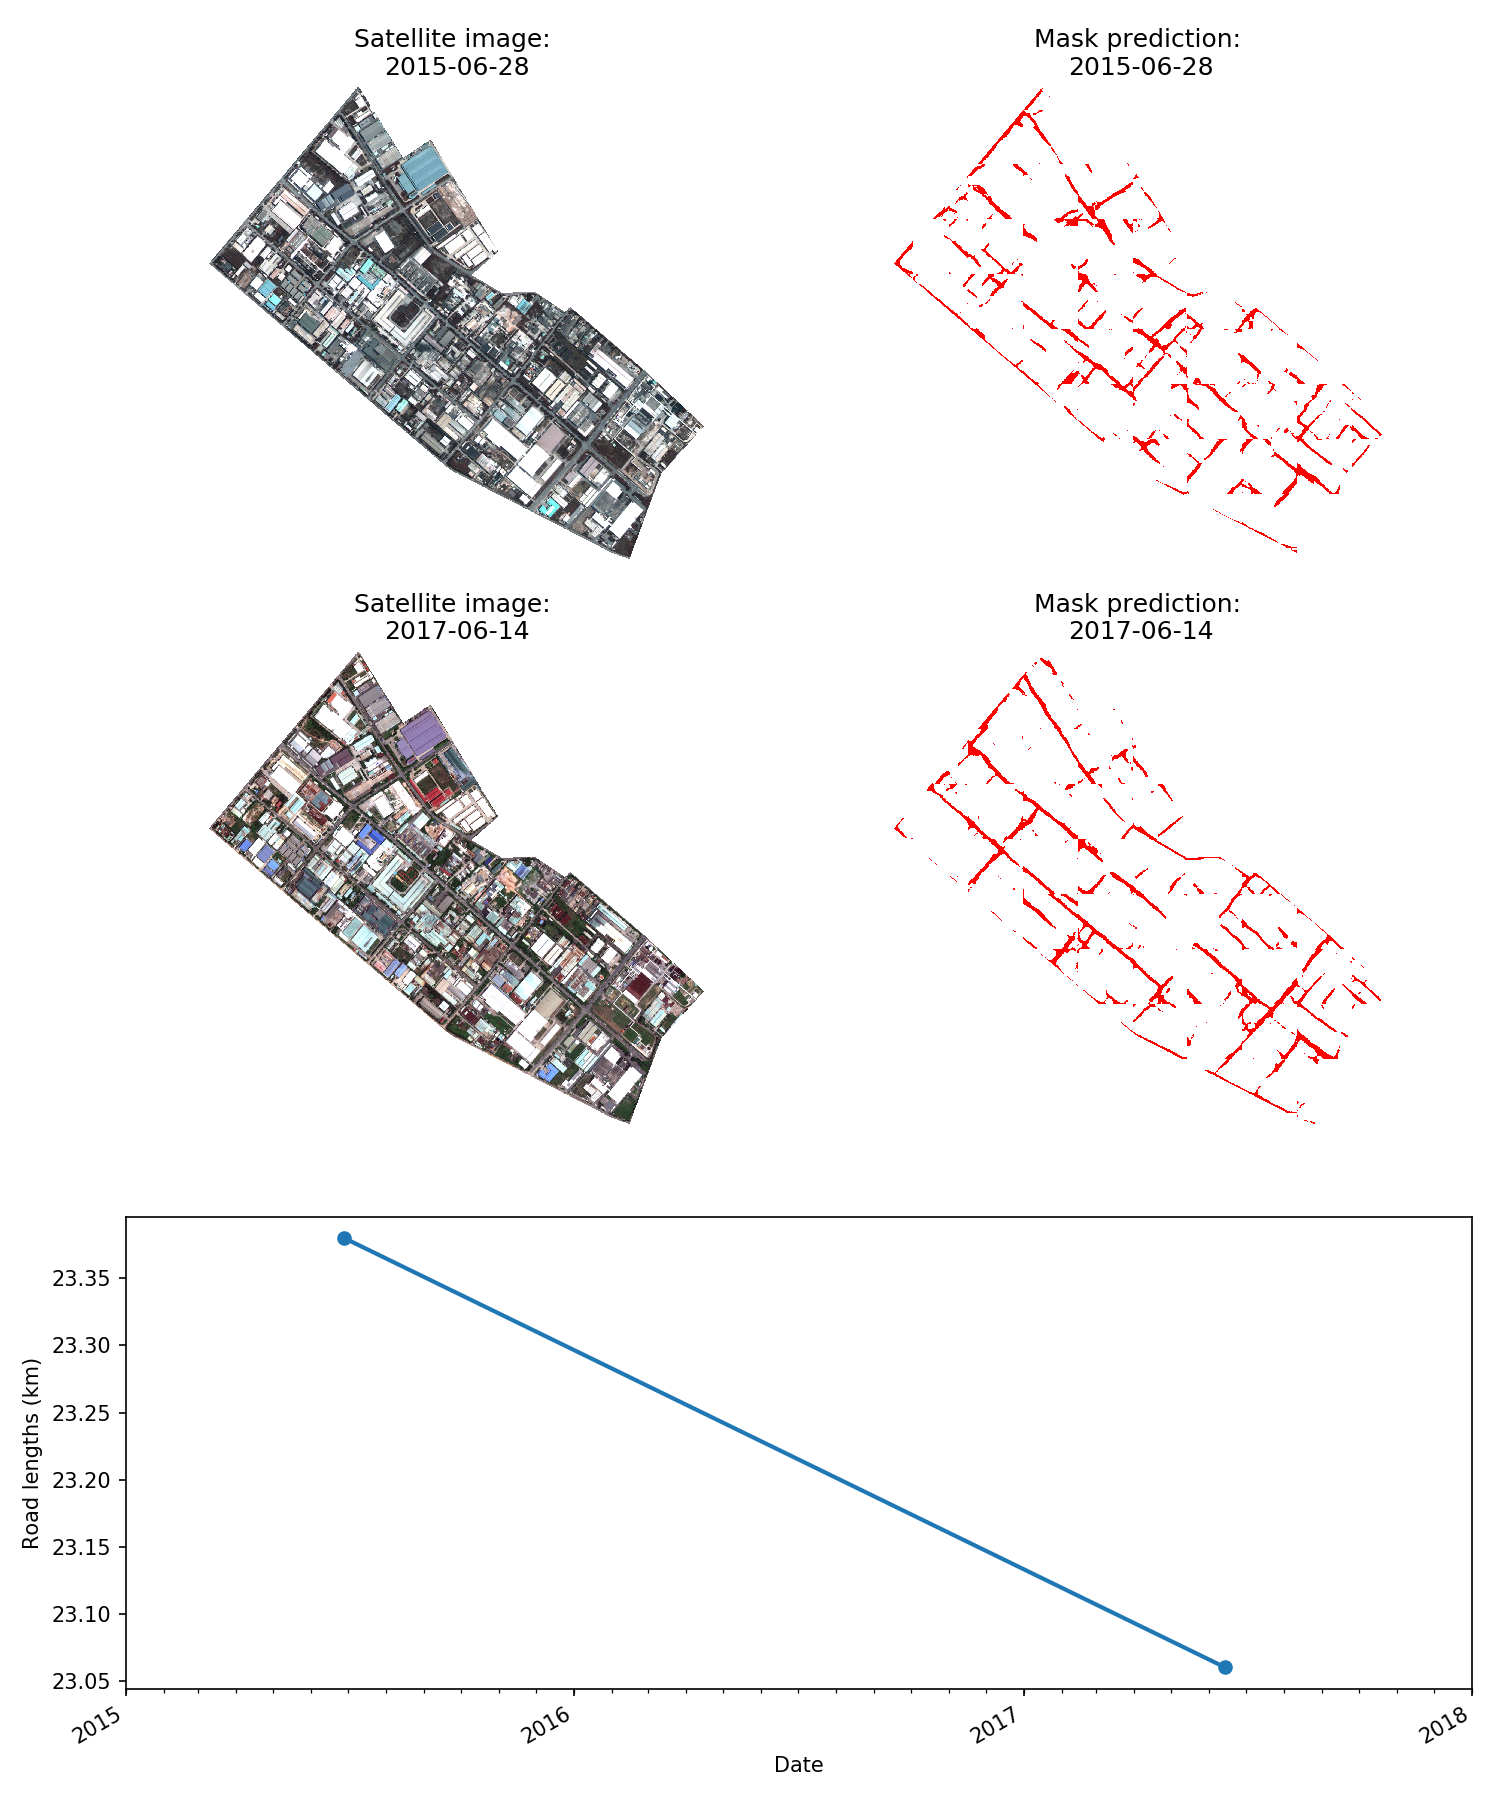
The total length of roadway (in km) was calculated using imagery from Digital Globe's Geoeye-01 and Worldview-02 satellites. Here, Skynet gives a reasonable road mask that correctly predicts similar total road lengths for both scenes. That said, there is still room for improvement as many of the major roads were incorrectly severed in the prediction.
Building Footprints
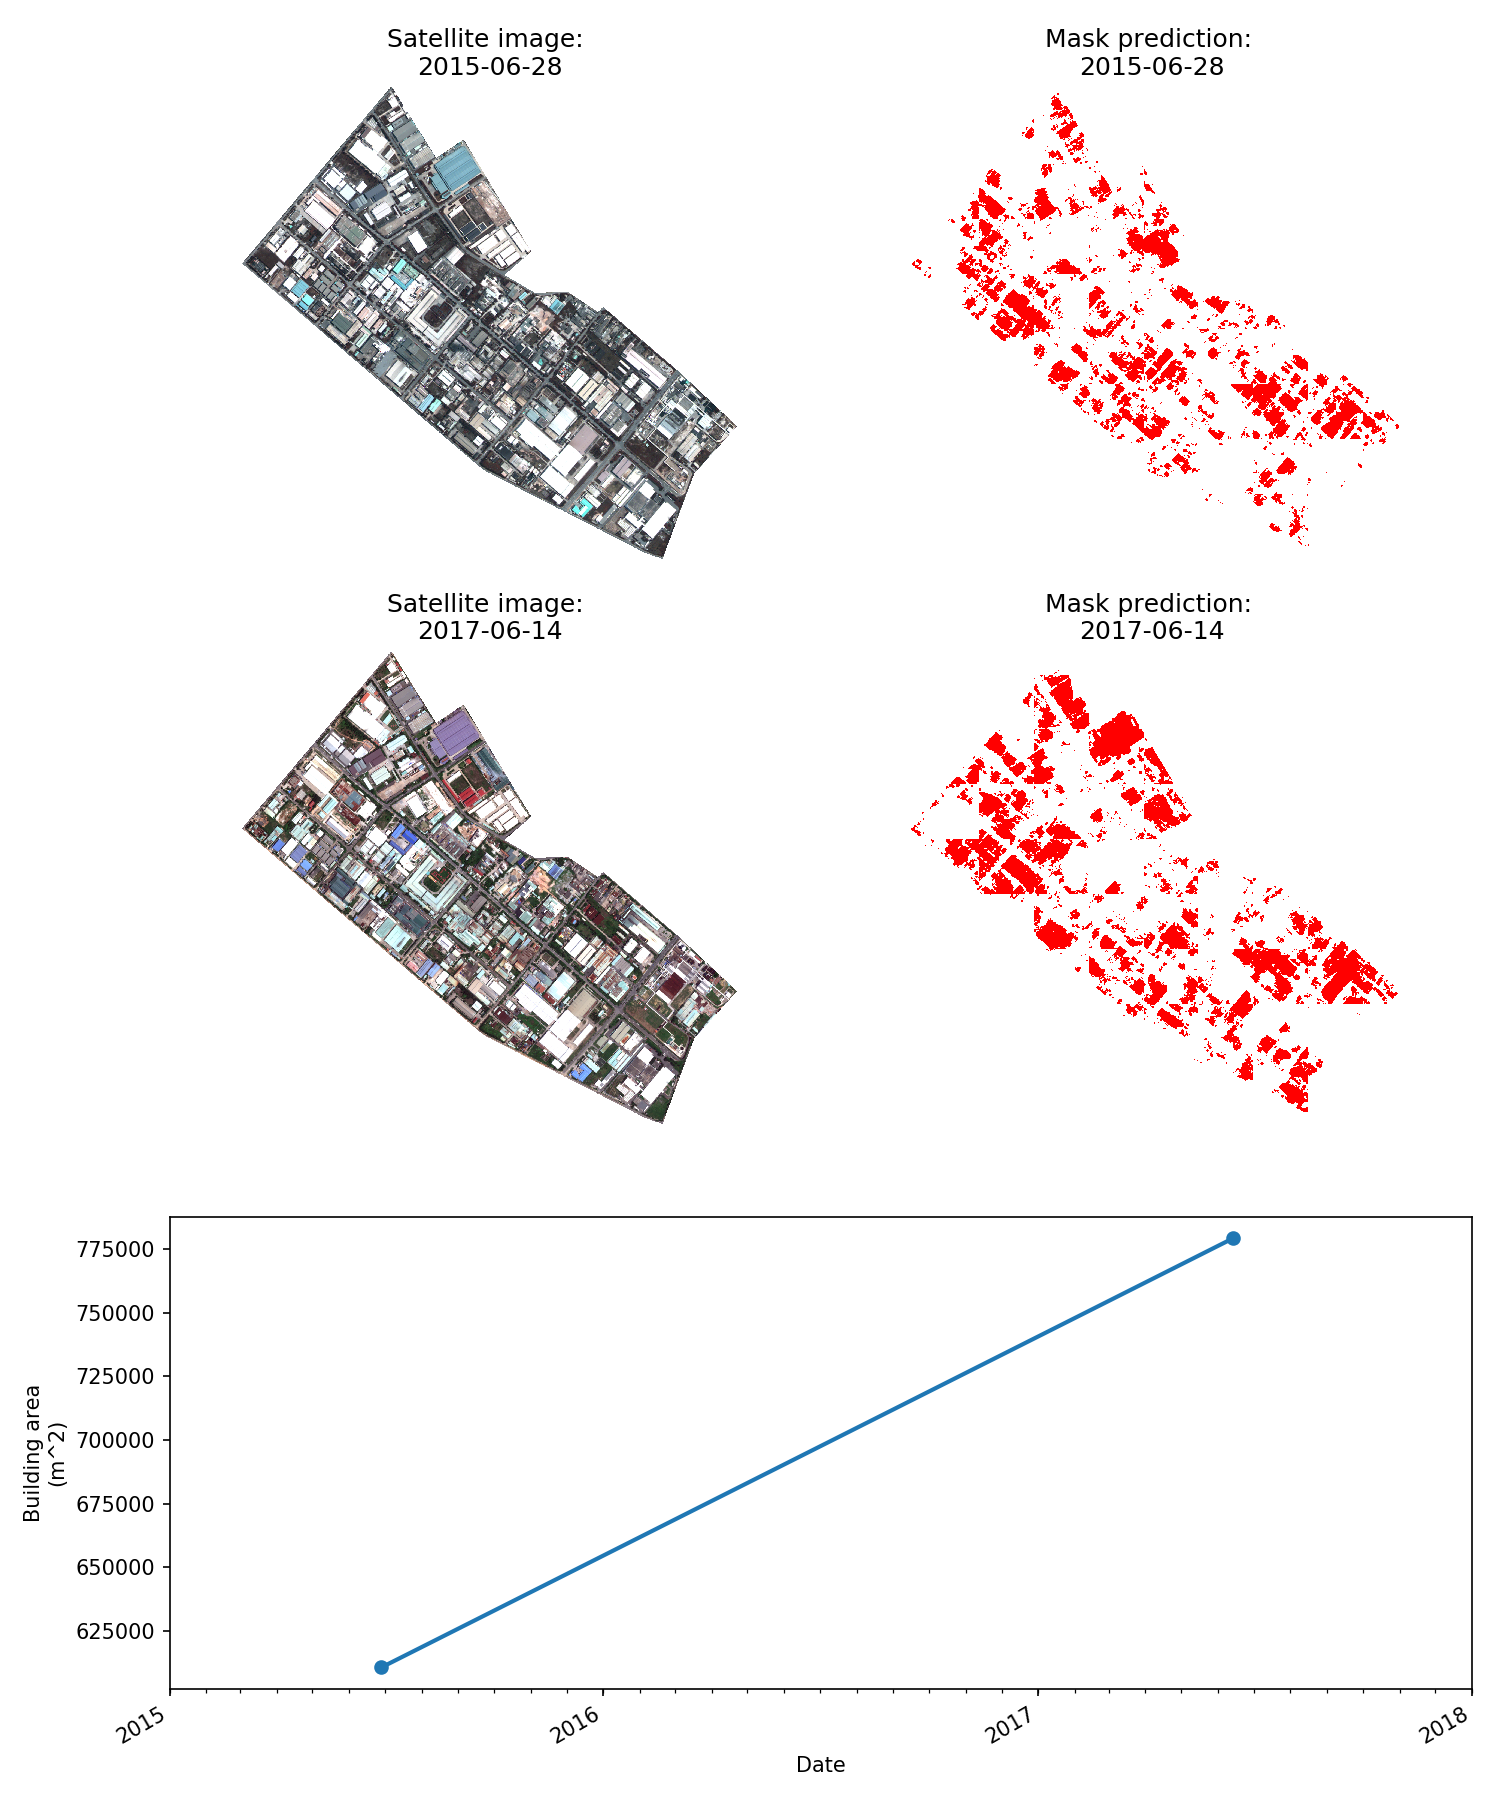
The total building area (in m^2) was calculated using imagery from Digital Globe's Geoeye-01 and Worldview-02 satellites. Here, Skynet gives a reasonable estimate of building footprint in this industrial zone despite high variation in shapes and colors. As observed in other zones, the Skynet model is fairly conservative.
Building Counts
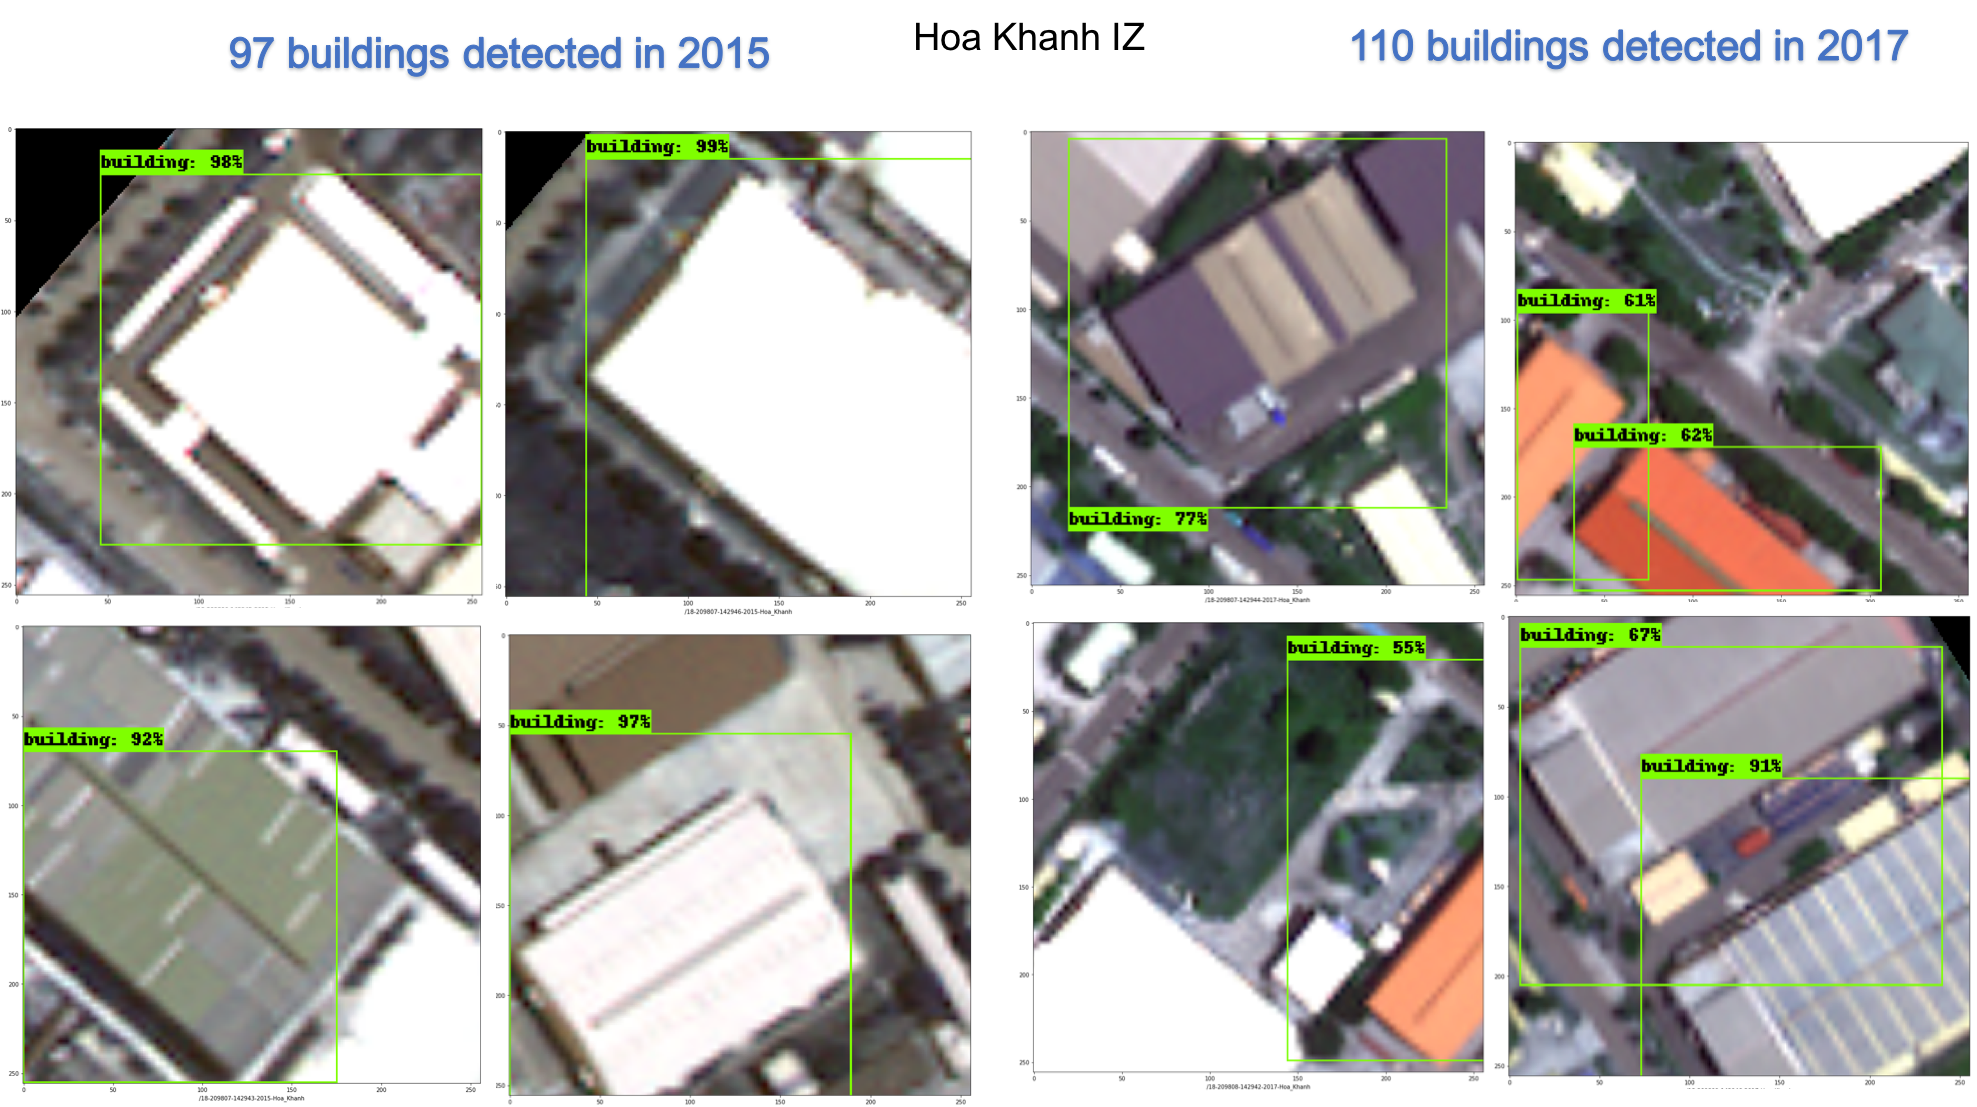
As a longer-term and well-established Industrial Zone, Hoa Khanh IZ site has dense independent as well as building clusters. From our Tensorflow object detection neural net, we detected 97 buildings from the GeoEye-01 image in 2015 and 110 buildings from Worldview-02 satellite image in 2017.
Electricity Consumption
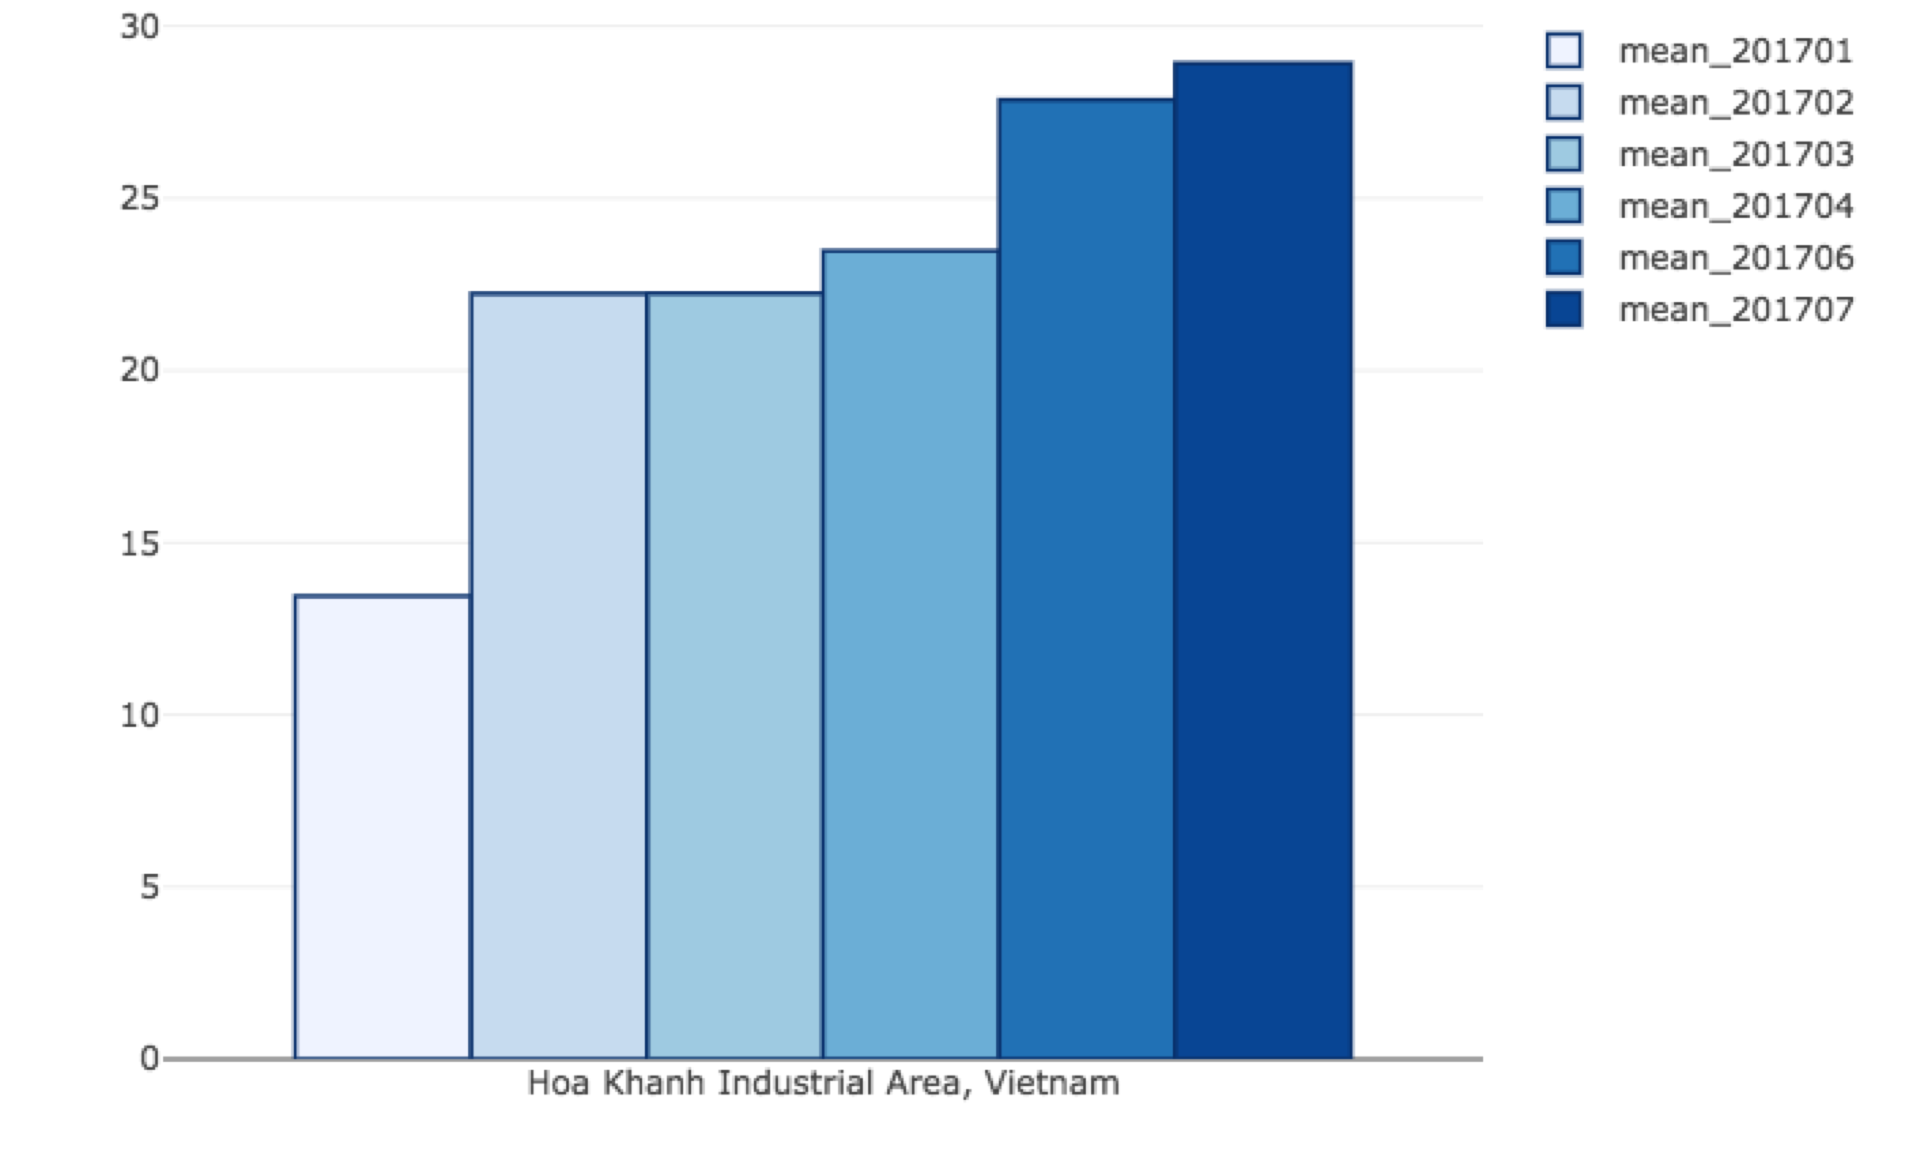
Electricity consumption is highly correlated to a region's economic activity. To estimate electricity consumption, we used the Visible Imaging Radiometer Suite (VIIRS) Day/Night Band (DNB) imagery to correlate nighttime light radiance. Specifically, monthly VIIRS DNB product from The Earth Observations Group (EOG) at NOAA/NGDC was used.
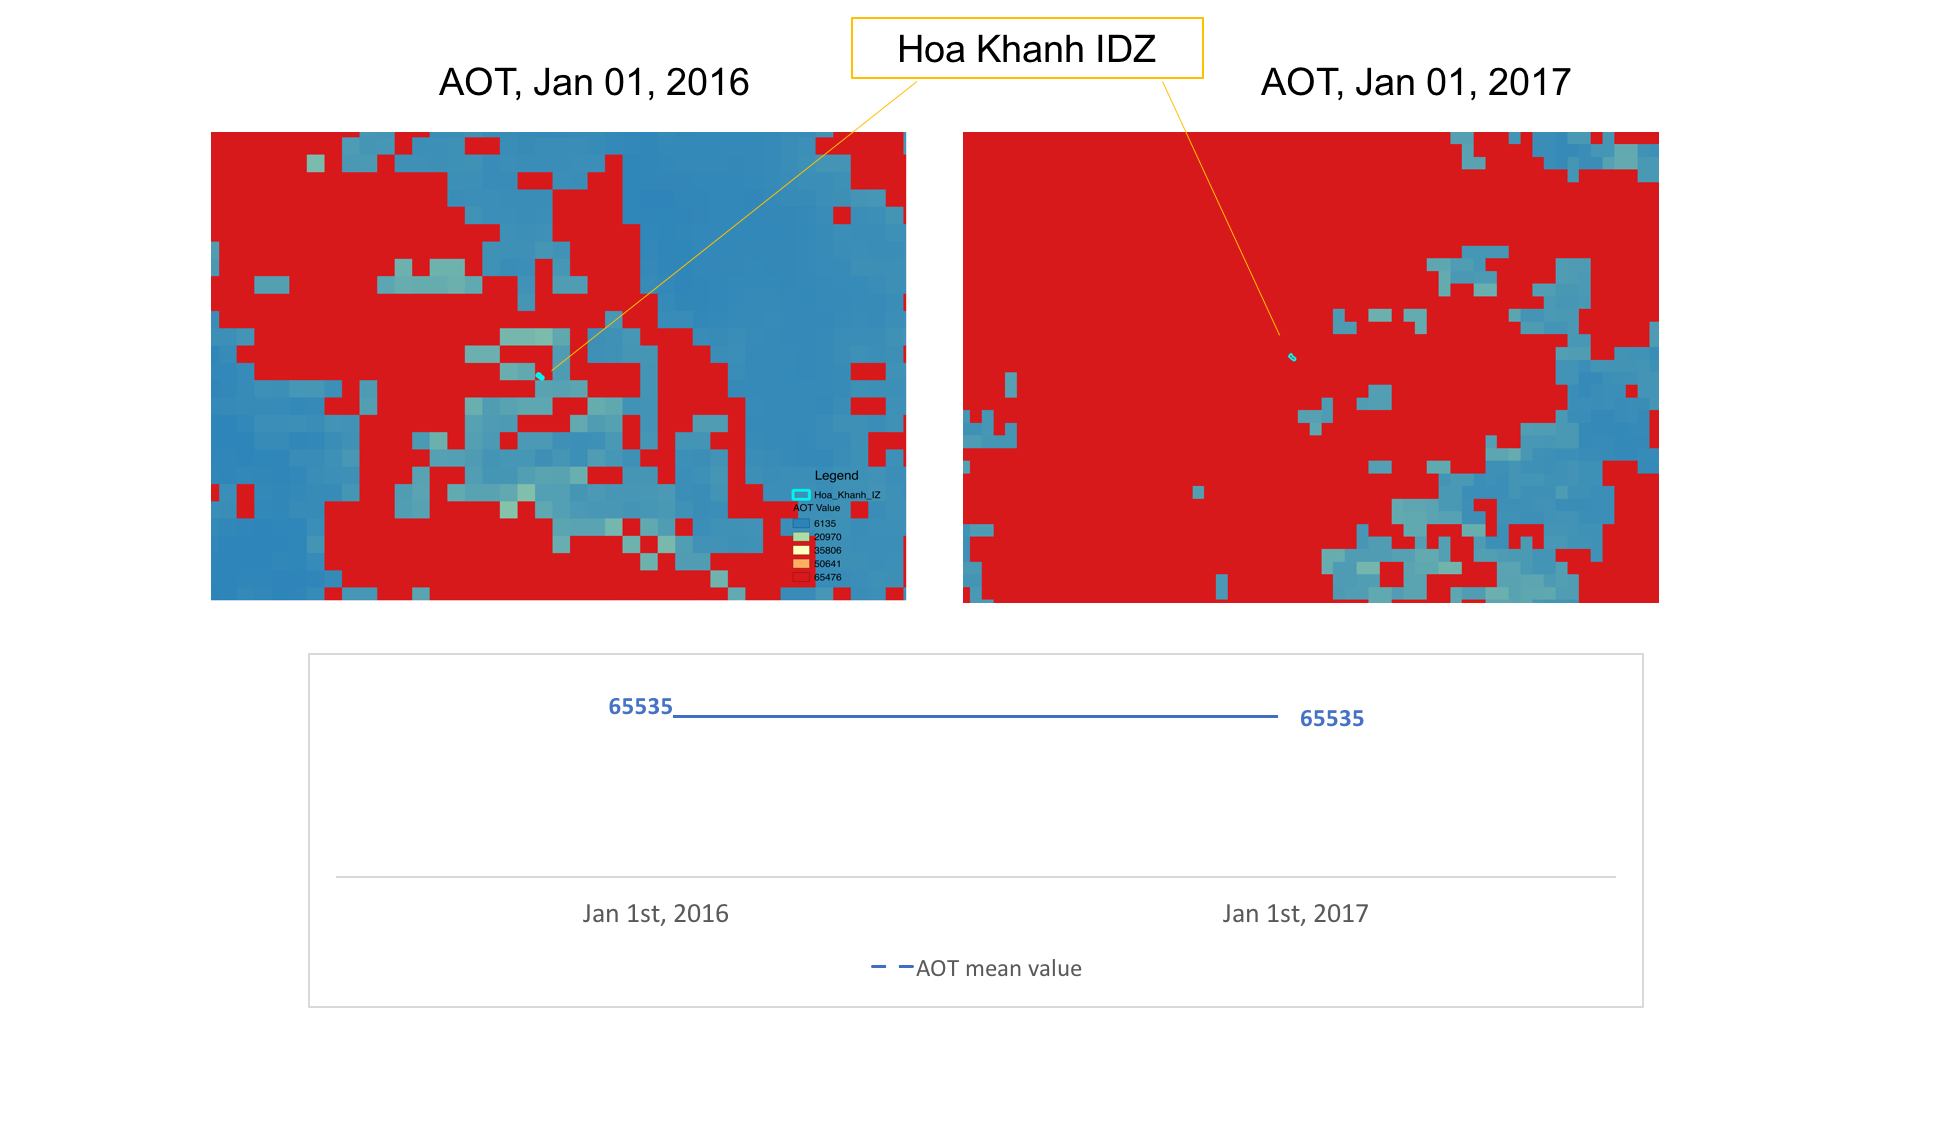
Pollution
Air quality and air pollution can also be monitored through VIIRS satellite imagery. Aerosol optical thickness (AOT) of VIIRS was obtained and processed as a proxy for air pollution indicator. Because it is related to the particulate matter, e.g. PM2.5, concentrations in the atmosphere, AOT is widely used for air quality and pollution applications. AOT imagery is recorded and updated daily at 6 km resolution.