Results
Linh Trung I EPZ
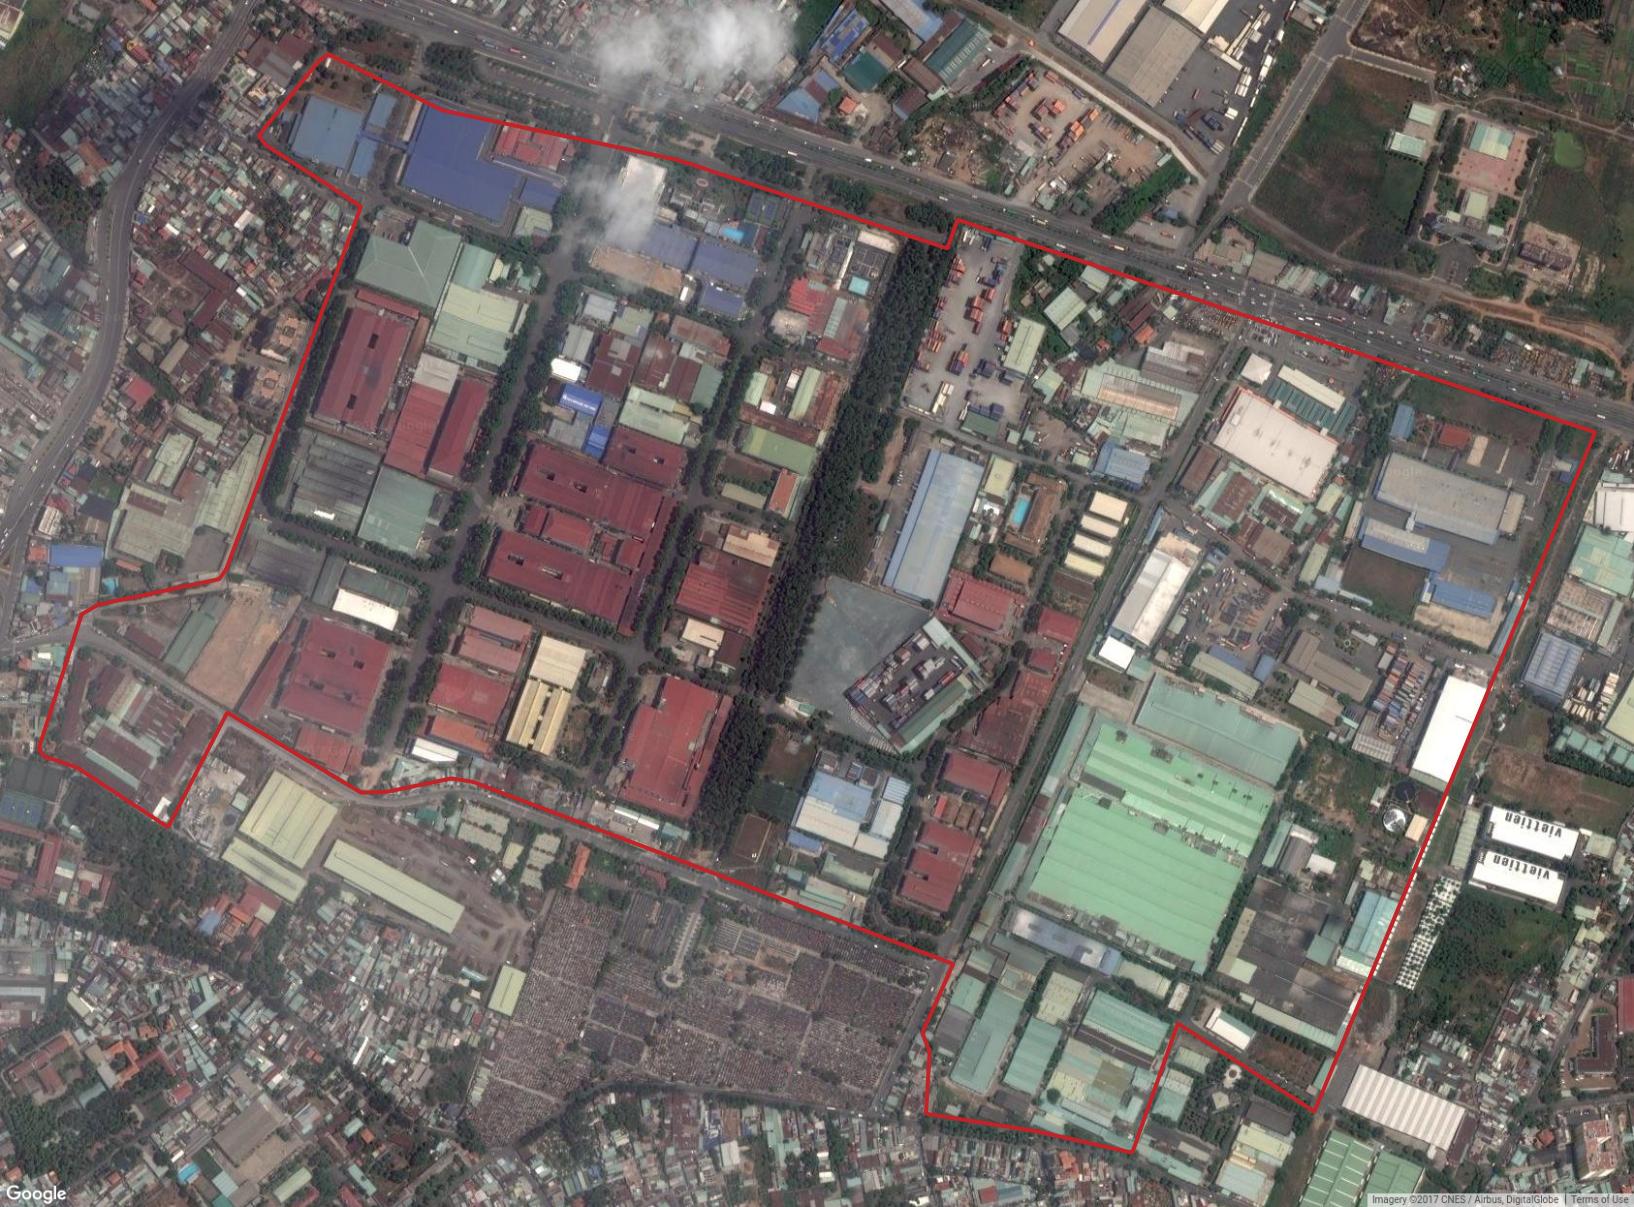
The Linh Trung Export Processing Zone is a joint Chinese-Vietnamese in the outskirts of Ho Chi Minh City, Vietnam. The total government venture is spread across 3 export processing zones (EPZ). EPZ 1 (62ha) being established in 1995, with a focus on light industry, export processing and machinery (EPZ and Industrial park (IP) 2 (61.7ha) was established in 2000 with standard factory buildings available for lease).
Sepzone Linh Trung is viewed as the most successful industrial projects in Vietnam, contributing extensively to “socioeconomic development of Ho Chi Minh City and of Vietnam as a whole”. Linh Trung I is adjacent to good infrastructural links - specifically to the national highway 1A, and has full occupancy with 31 investors. Vietnam’s EPZ sites are purported to have reached a total export volume of over USD 1.971billion, while offering 75,000 jobs to local workers.
Identifying the impact of Linh Trung I in isolation is hard to unpick, but according to vietnam business forum: “turnover of tenants in Linh Trung EPZ has been on the steady rise over the past years and have made significant contributions to economic development in Ho Chi Minh City and in Vietnam. If the value was only US$1.4 billion in 2006, it soared to US$2.9 billion in 2010 and US$2.95 billion as of November 2011.The greater success of Linh Trung EPZ is that it has given a facelift to the locality, not only generating thousands of full-time jobs for local workers but also jobs for thousands of families.”
- Size analyzed: 134 hectares
- Established: 1995
- Phase: Operational
Analysis
The macro-economic impact of the Linh Trung EPZ simply cannot be separated from the economic development of Ho Chi Minh City as a whole, given the site’s close proximity to such a highly populated, and continually urbanizing conurbation. However the embedding of Linh Trung within this broader urban context also makes it extremely difficult to attribute any particularly regional macro-indicator as having been directly impacted by the SEZ, apart from balance of trade.
Nonetheless, the influx of investment into the SEZ is now well documented and consequently the need to leverage micro-indicators as a substitute is lessened - its internal success is probably established. However, Quantifying this success in terms of increased activity in terms of freight, good distribution, an international reach is attainable through CDR analysis.
Analysis of employment levels in the SEZ, and whether claims of 70,000 jobs being created are accurate is also assessable by such behavioural data streams. Industrial units have seen a relatively high turnover, and this is also likely examinable via CDR or night light analysis.
Use of land classification is less effective for mature sites of this nature, especially those situated in densely populated areas. Land-use class distributions are unlikely to shift (in fact, this is evidenced directly by the minor changes in land-use distributions presented in our Phase I analysis), and while building footprint scores increase, visual analysis indicates that this is likely due to new roof materials increasing sensitivity of techniques.
There have been reports (2006) that this well established zone has periodically seen a shortage of available workforce - here longitudinal CDR data would be an invaluable micro-indicator of such claims (through identification of unique account usage of cell towers) allowing understanding of such employment cycles.
Land Classification
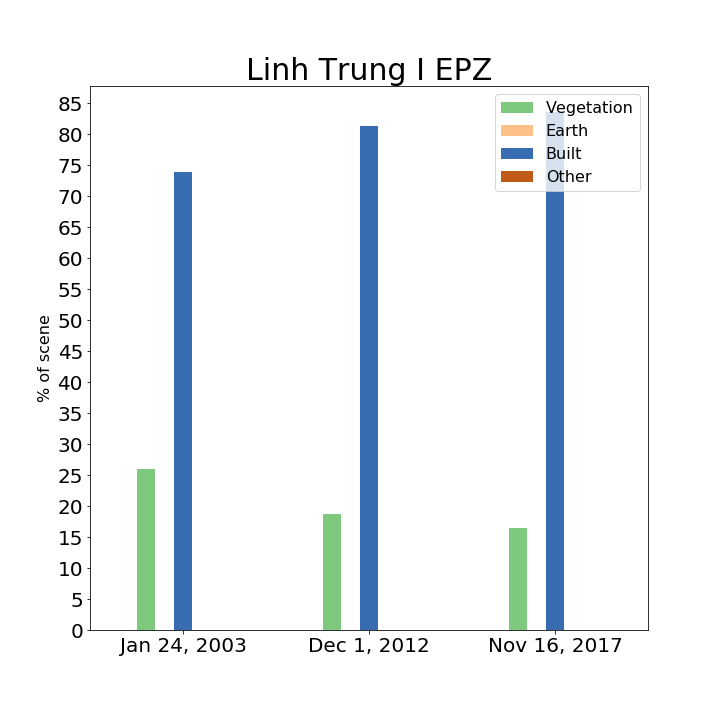
While the first image available is when the zone was already 12 years old, there 3 images shown below still show development over a 14 year period: 2003, 2012, and 2017. The zone was largely filled with built areas, with the remaining part as vegetation. By 2012, some of the vegetation is built upon, and some more in 2017.
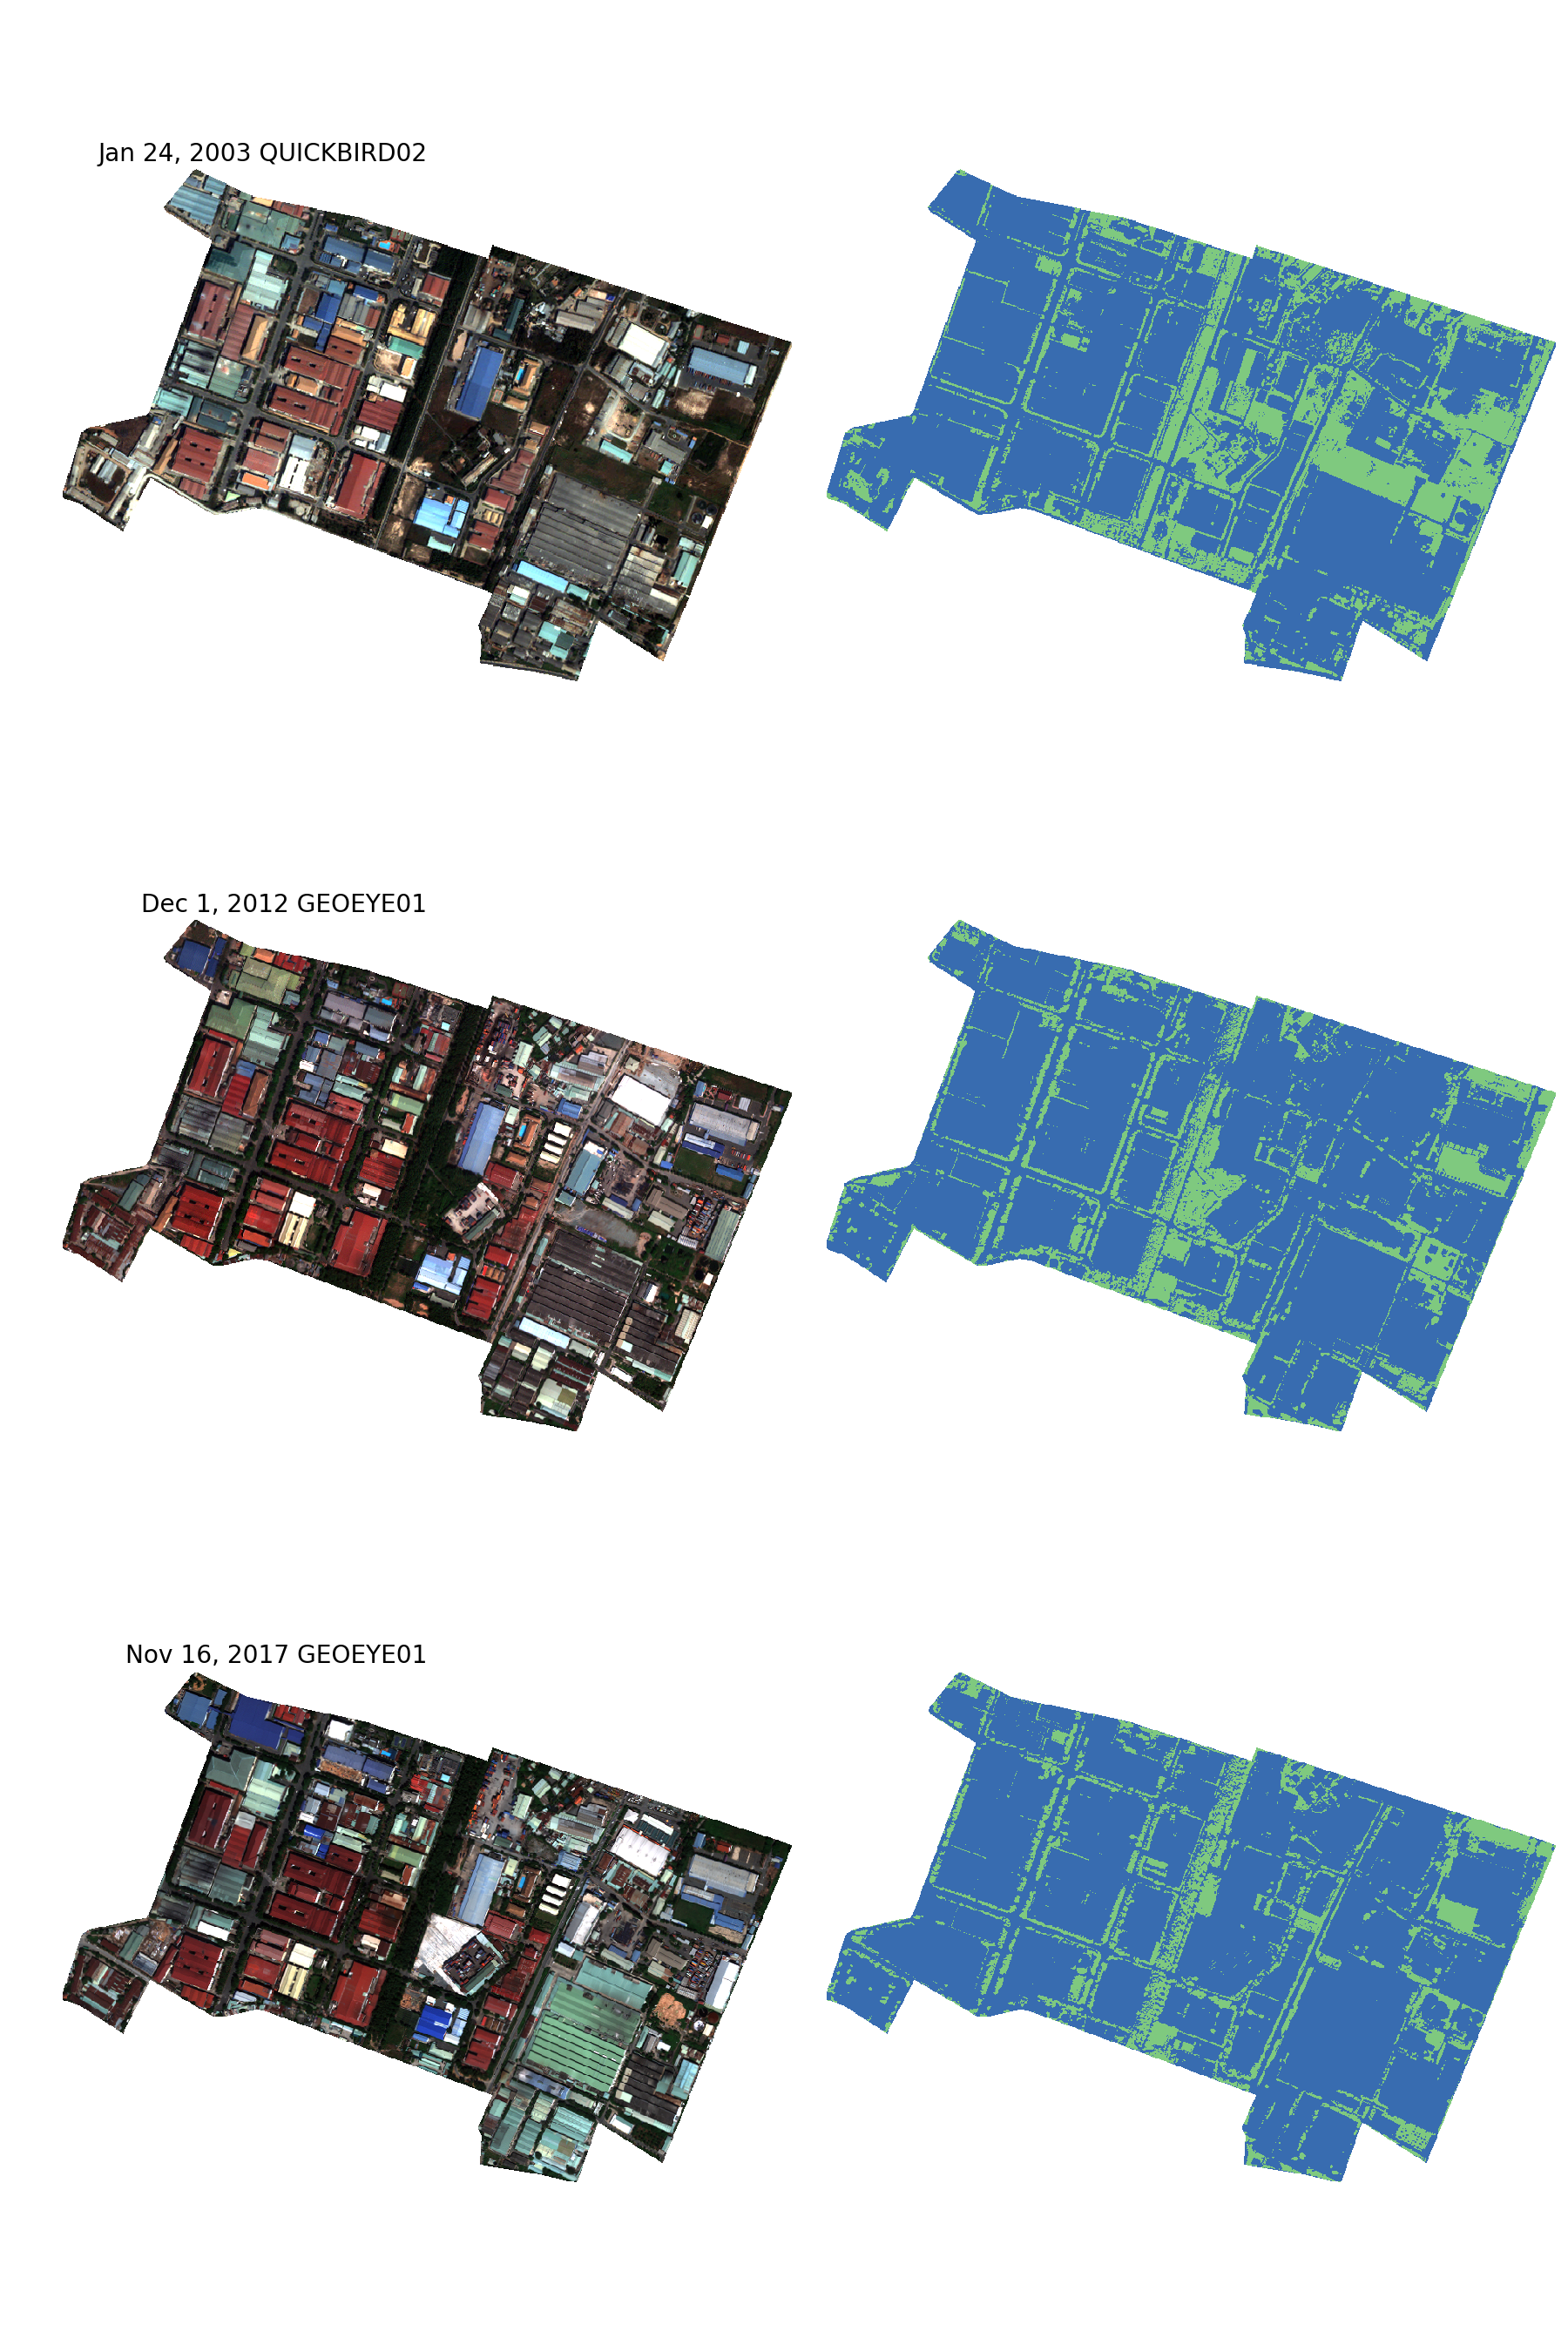
The class percentages here clearly show the conversion of the remaining vegetation areas into buildings.
Transport Infrastructure
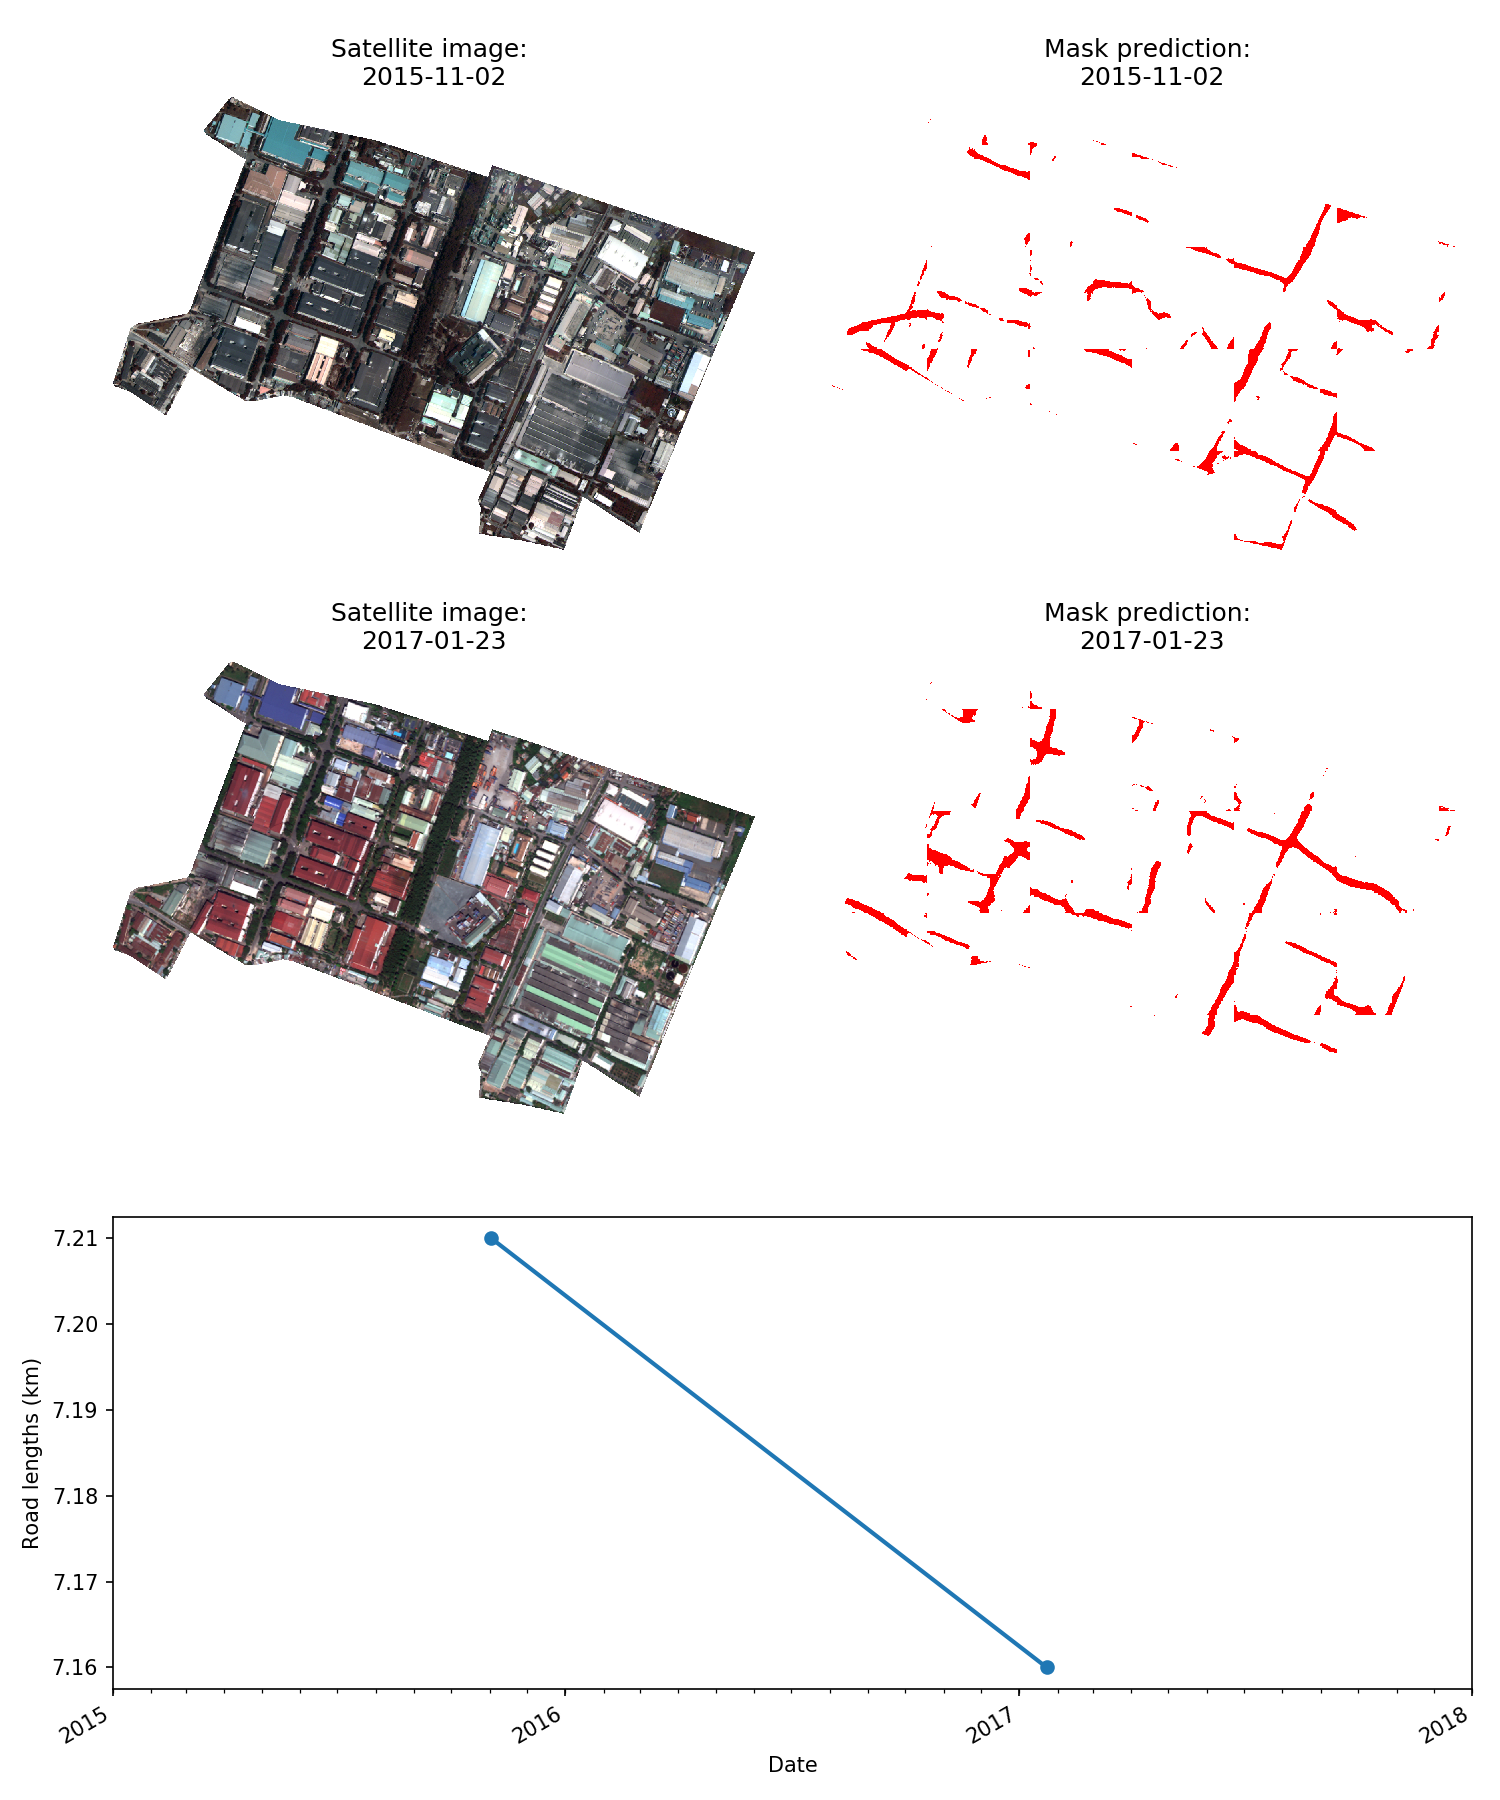
The total length of roadway (in km) was calculated using imagery from Digital Globe's Geoeye-01 and Worldview-03 satellites. Here, Skynet gives a reasonable road mask that correctly predicts little change between the two scenes. That said, there is still room for improvement as many of the major roads were incorrectly severed in the prediction.
Building Footprints
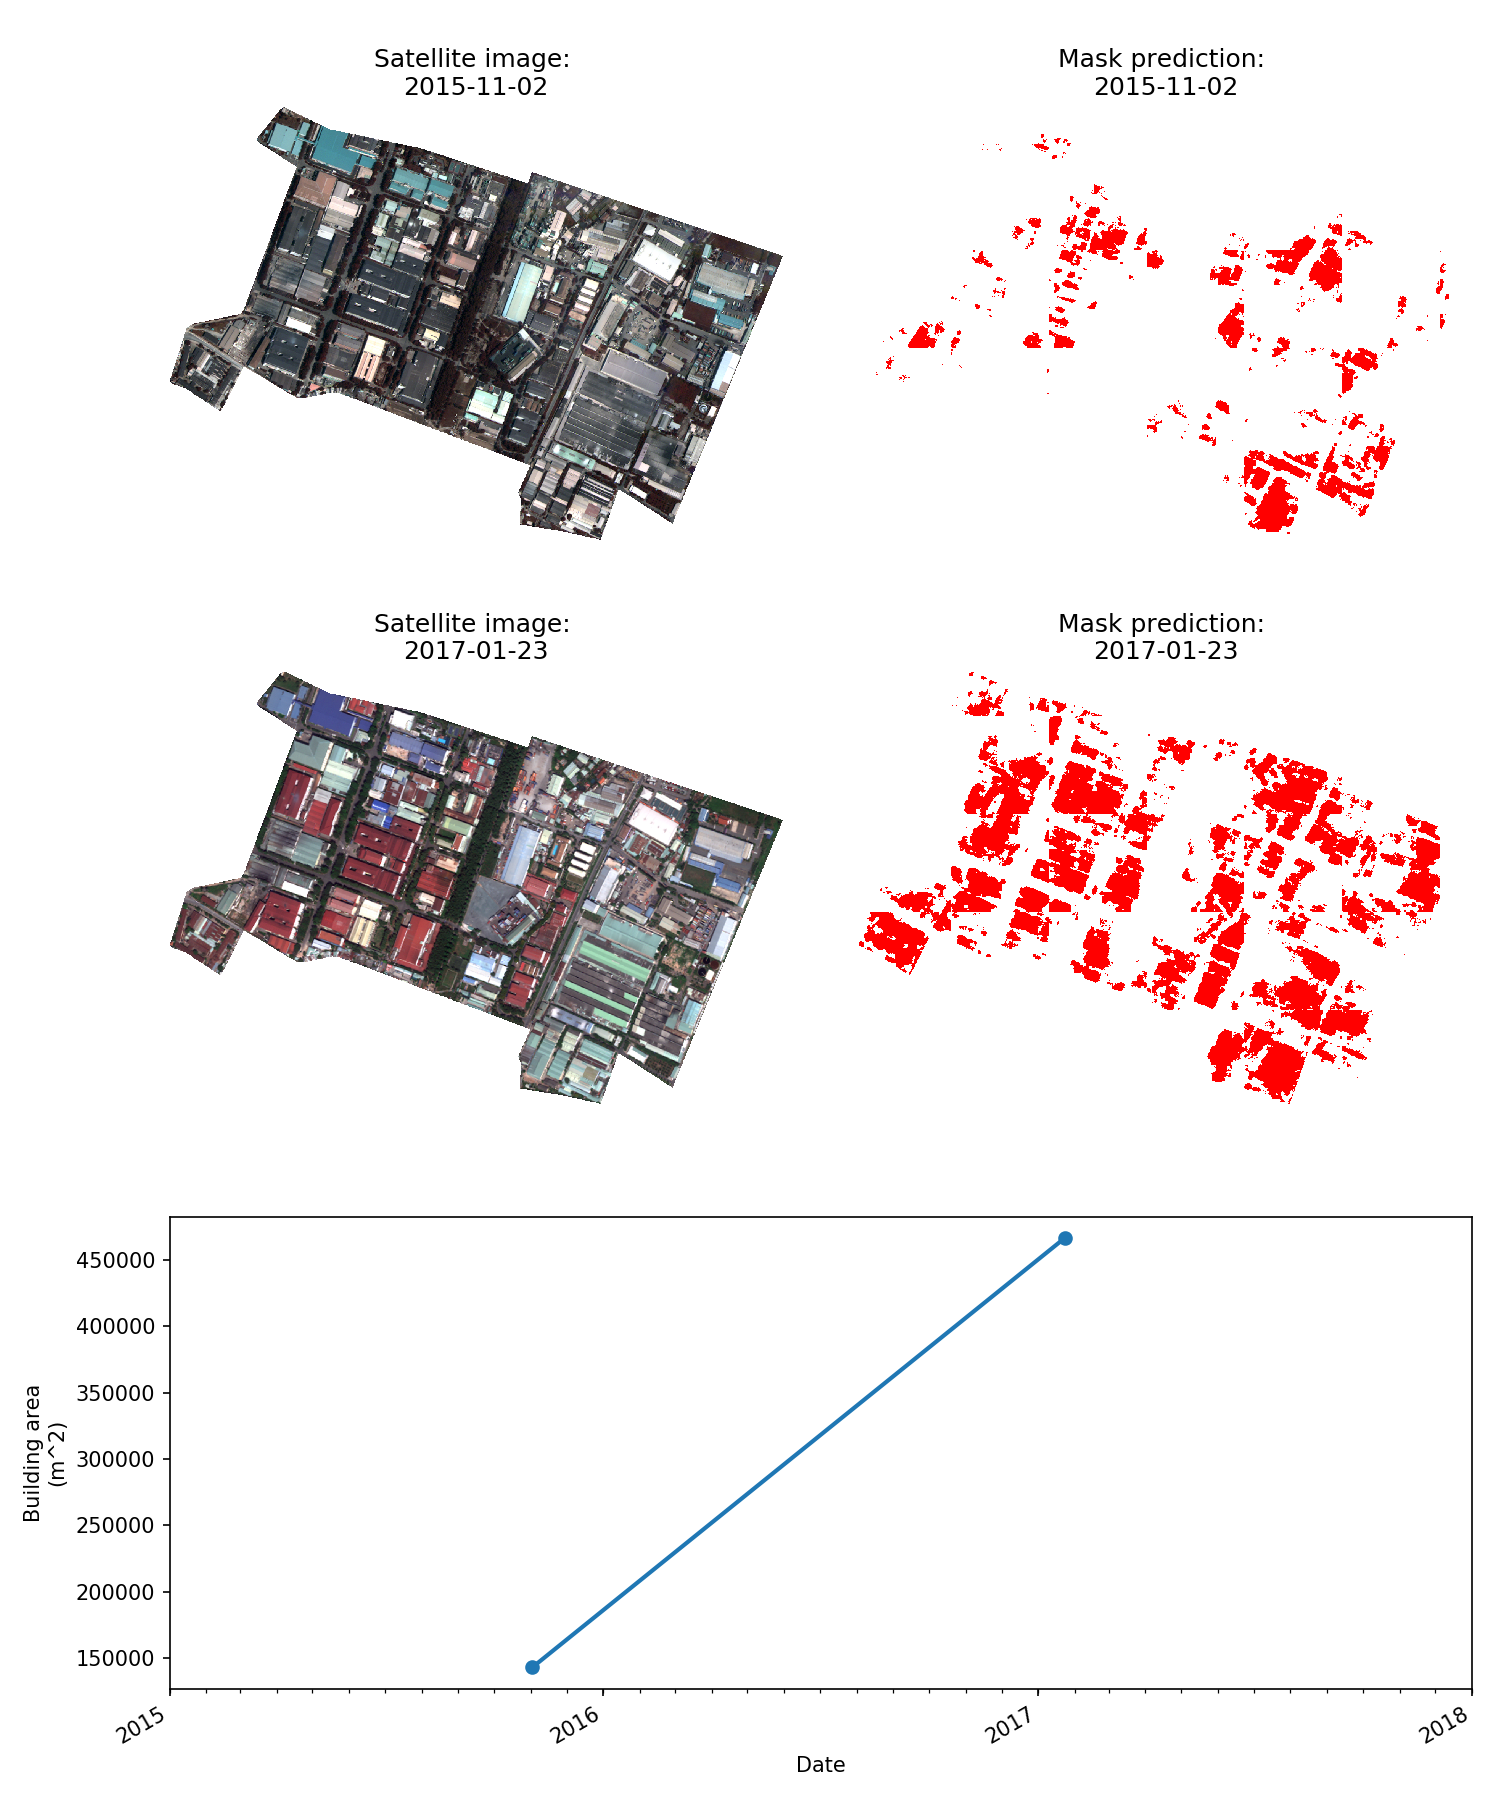
The total building area (in m^2) was calculated using imagery from Digital Globe's Geoeye-01 and Worldview-03 satellites. Skynet does not do a great job segmenting buildings, particularly in the first scene. This may be because many of the 2015 scene's roofs are dark and not very distinct leading to an underestimation of building footprint. Contrast these with the roofs in the 2017 scene that appear to have be redone with red-colored material and yielding a more accurate prediction.
Building Counts
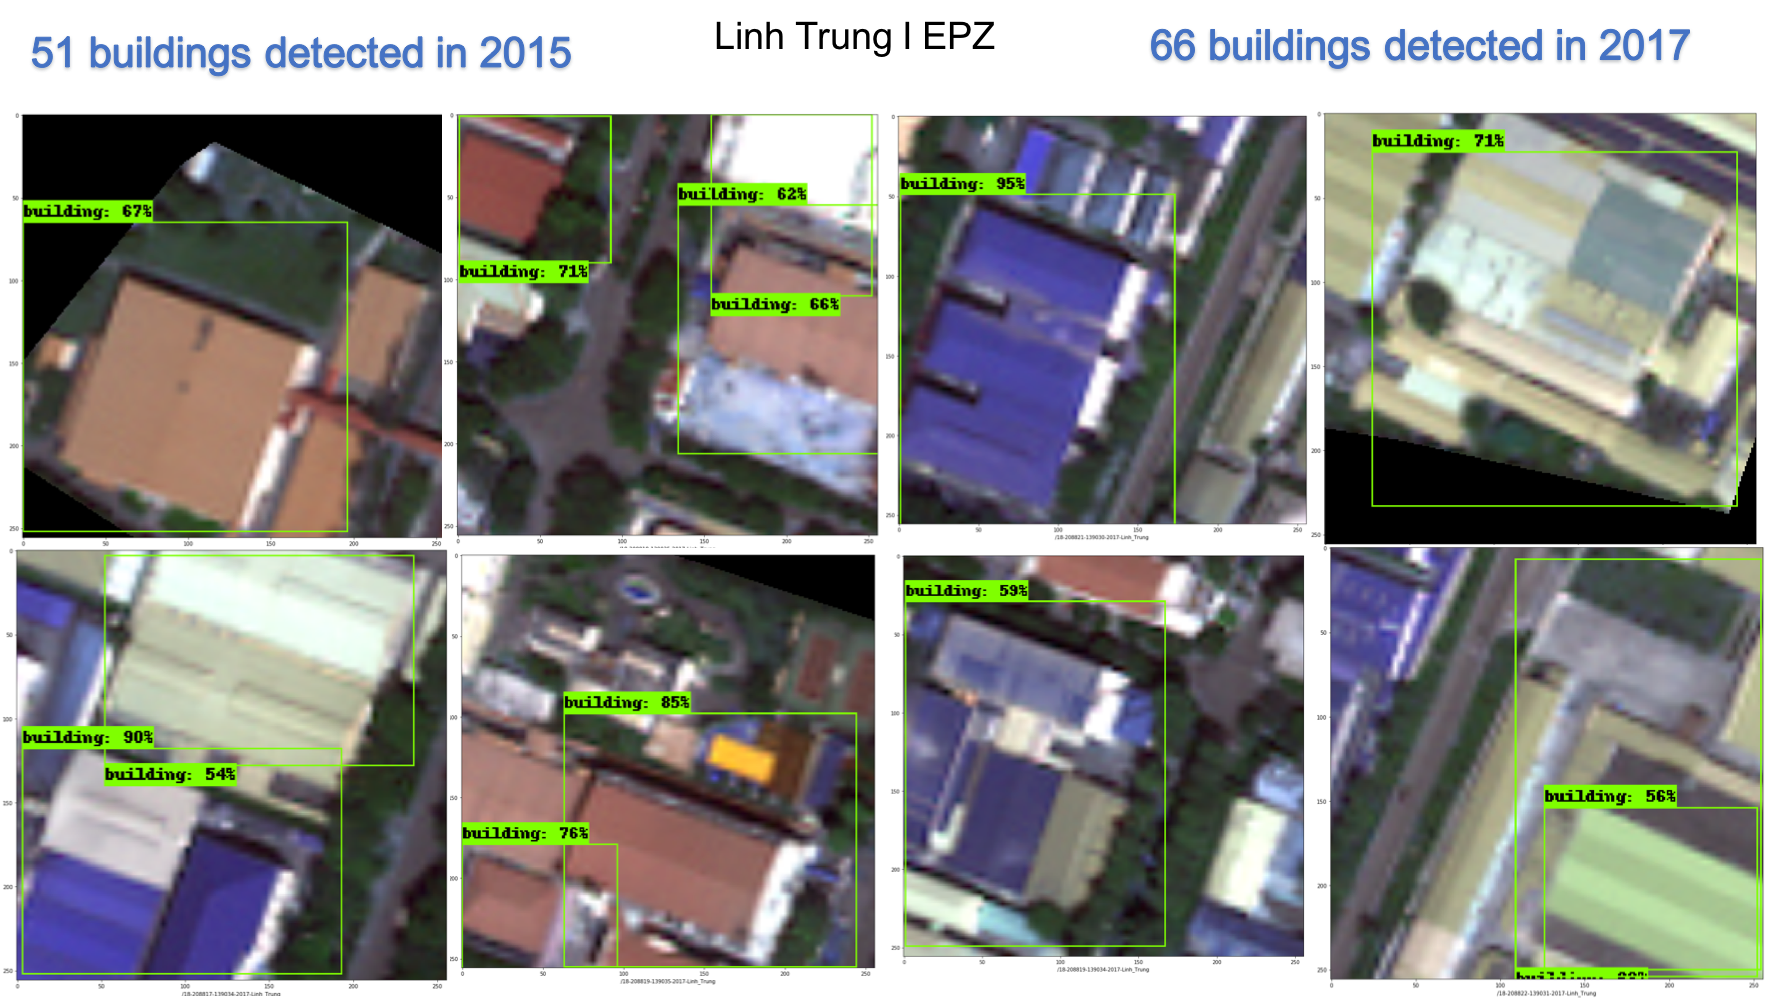
As another well-operated and long-established Export Processing Zone in Vietnam, Linh Trung I EPZ site has very dense and large buildings. From our Tensorflow object detection neural net, we detected 51 buildings from the GeoEye-01 image in 2015 and 110 buildings from Worldview-03 satellite image in 2017.
Electricity Consumption
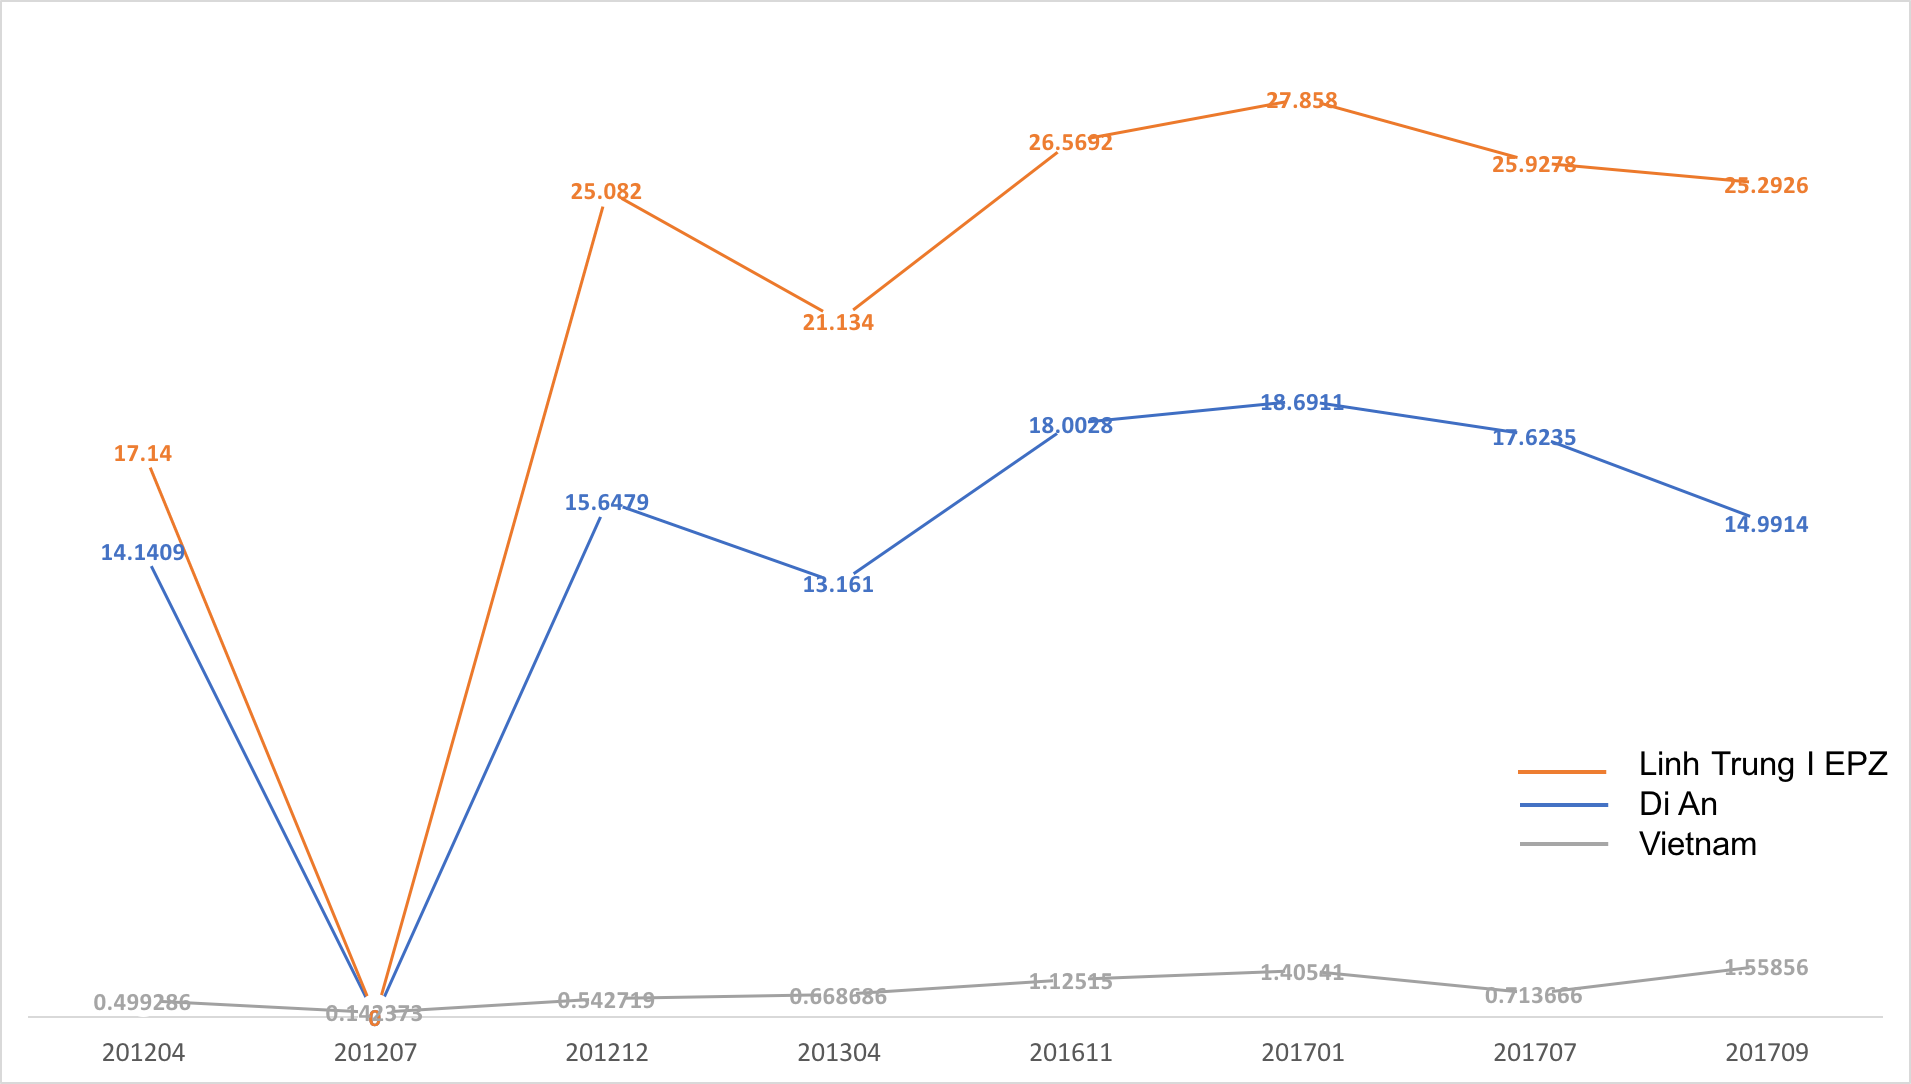
Electricity consumption is highly correlated to a region's economic activity. To estimate electricity consumption, we used the Visible Imaging Radiometer Suite (VIIRS) Day/Night Band (DNB) imagery to correlate nighttime light radiance. Specifically, monthly VIIRS DNB product from The Earth Observations Group (EOG) at NOAA/NGDC was used.
As one of long-established SEZ sites, electricity consumption of Linh Trung I EPZ has exceeded its nearby city Di An, and it's also much higher than the national level in Vietnam. The average growth rate is pretty rapid as well.
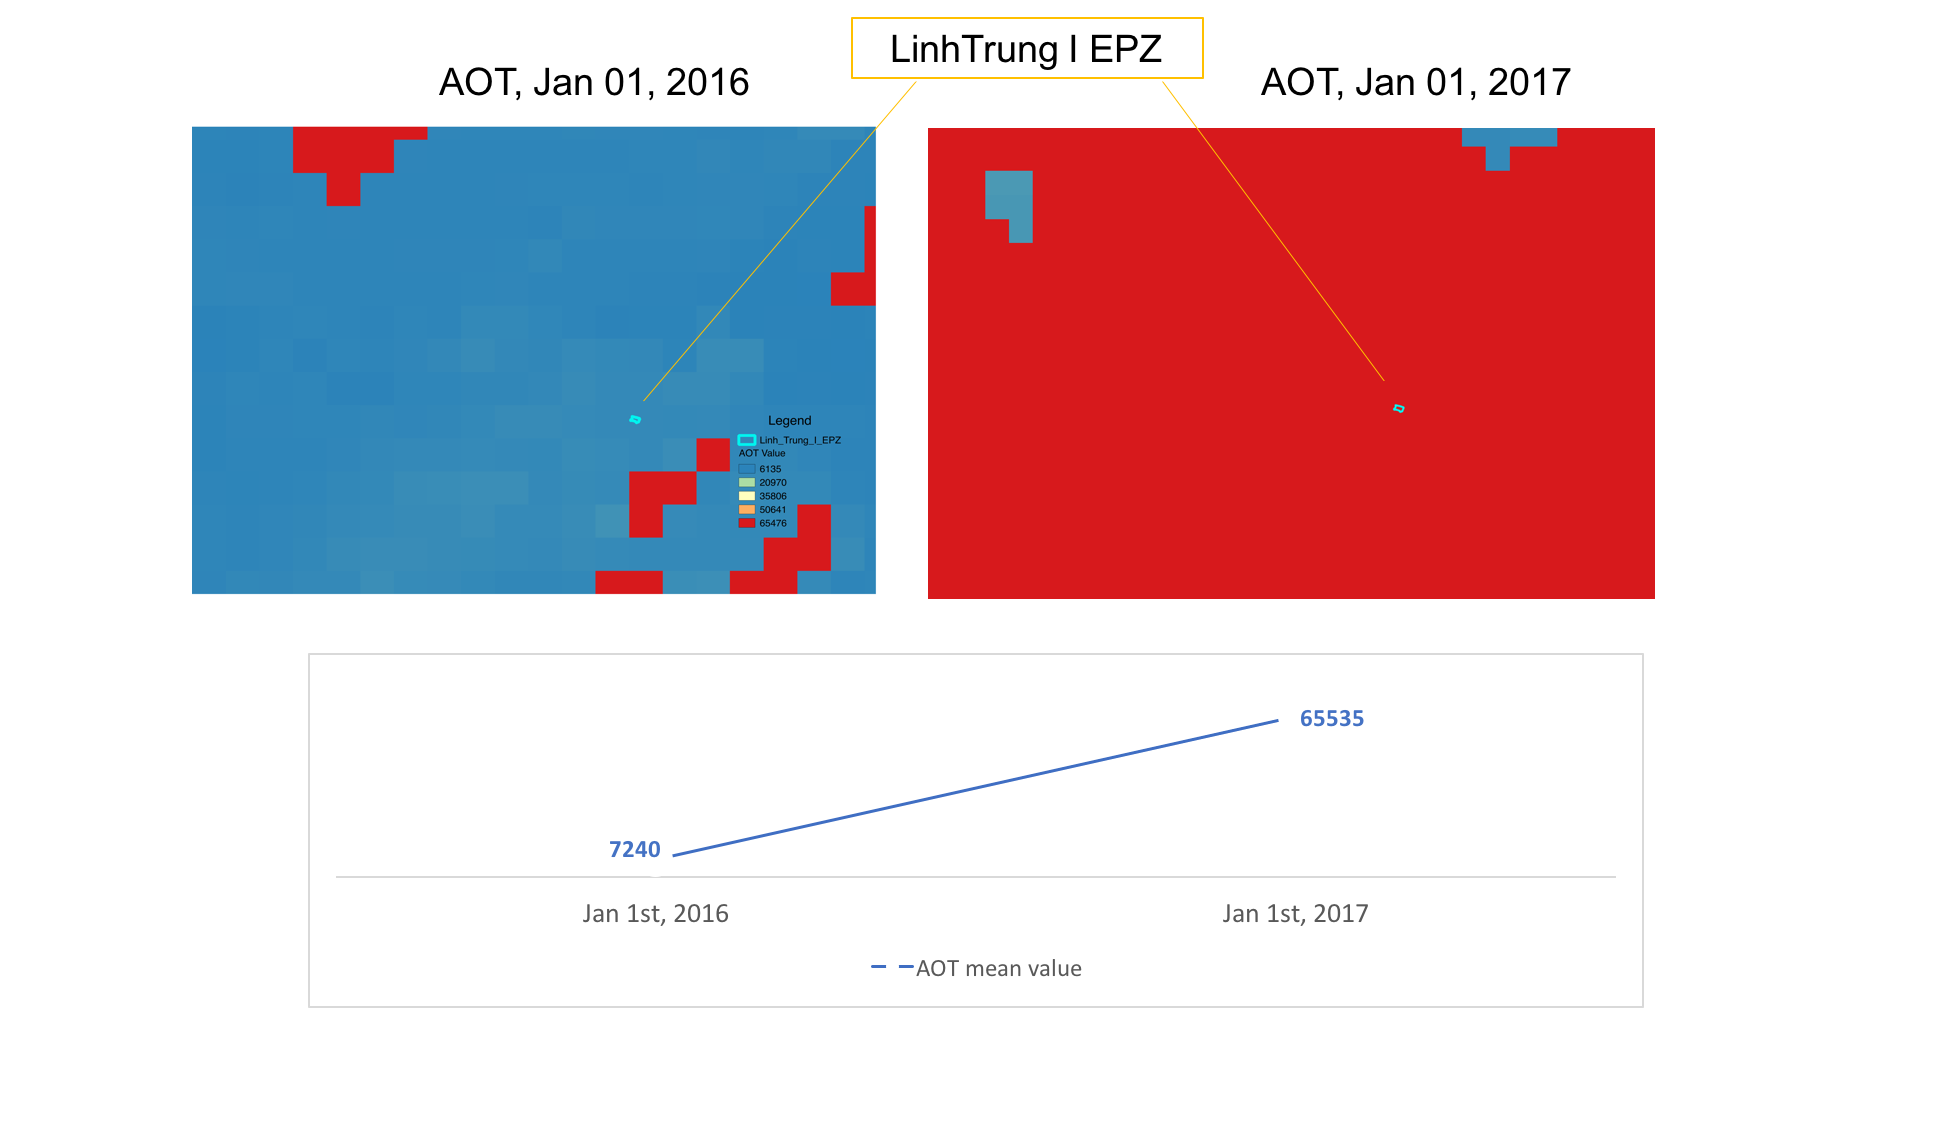
Pollution
Air quality and air pollution can also be monitored through VIIRS satellite imagery. Aerosol optical thickness (AOT) of VIIRS was obtained and processed as a proxy for air pollution indicator. Because it is related to the particulate matter, e.g. PM2.5, concentrations in the atmosphere, AOT is widely used for air quality and pollution applications. AOT imagery is recorded and updated daily at 6 km resolution.