Results
Pinthong GIZ
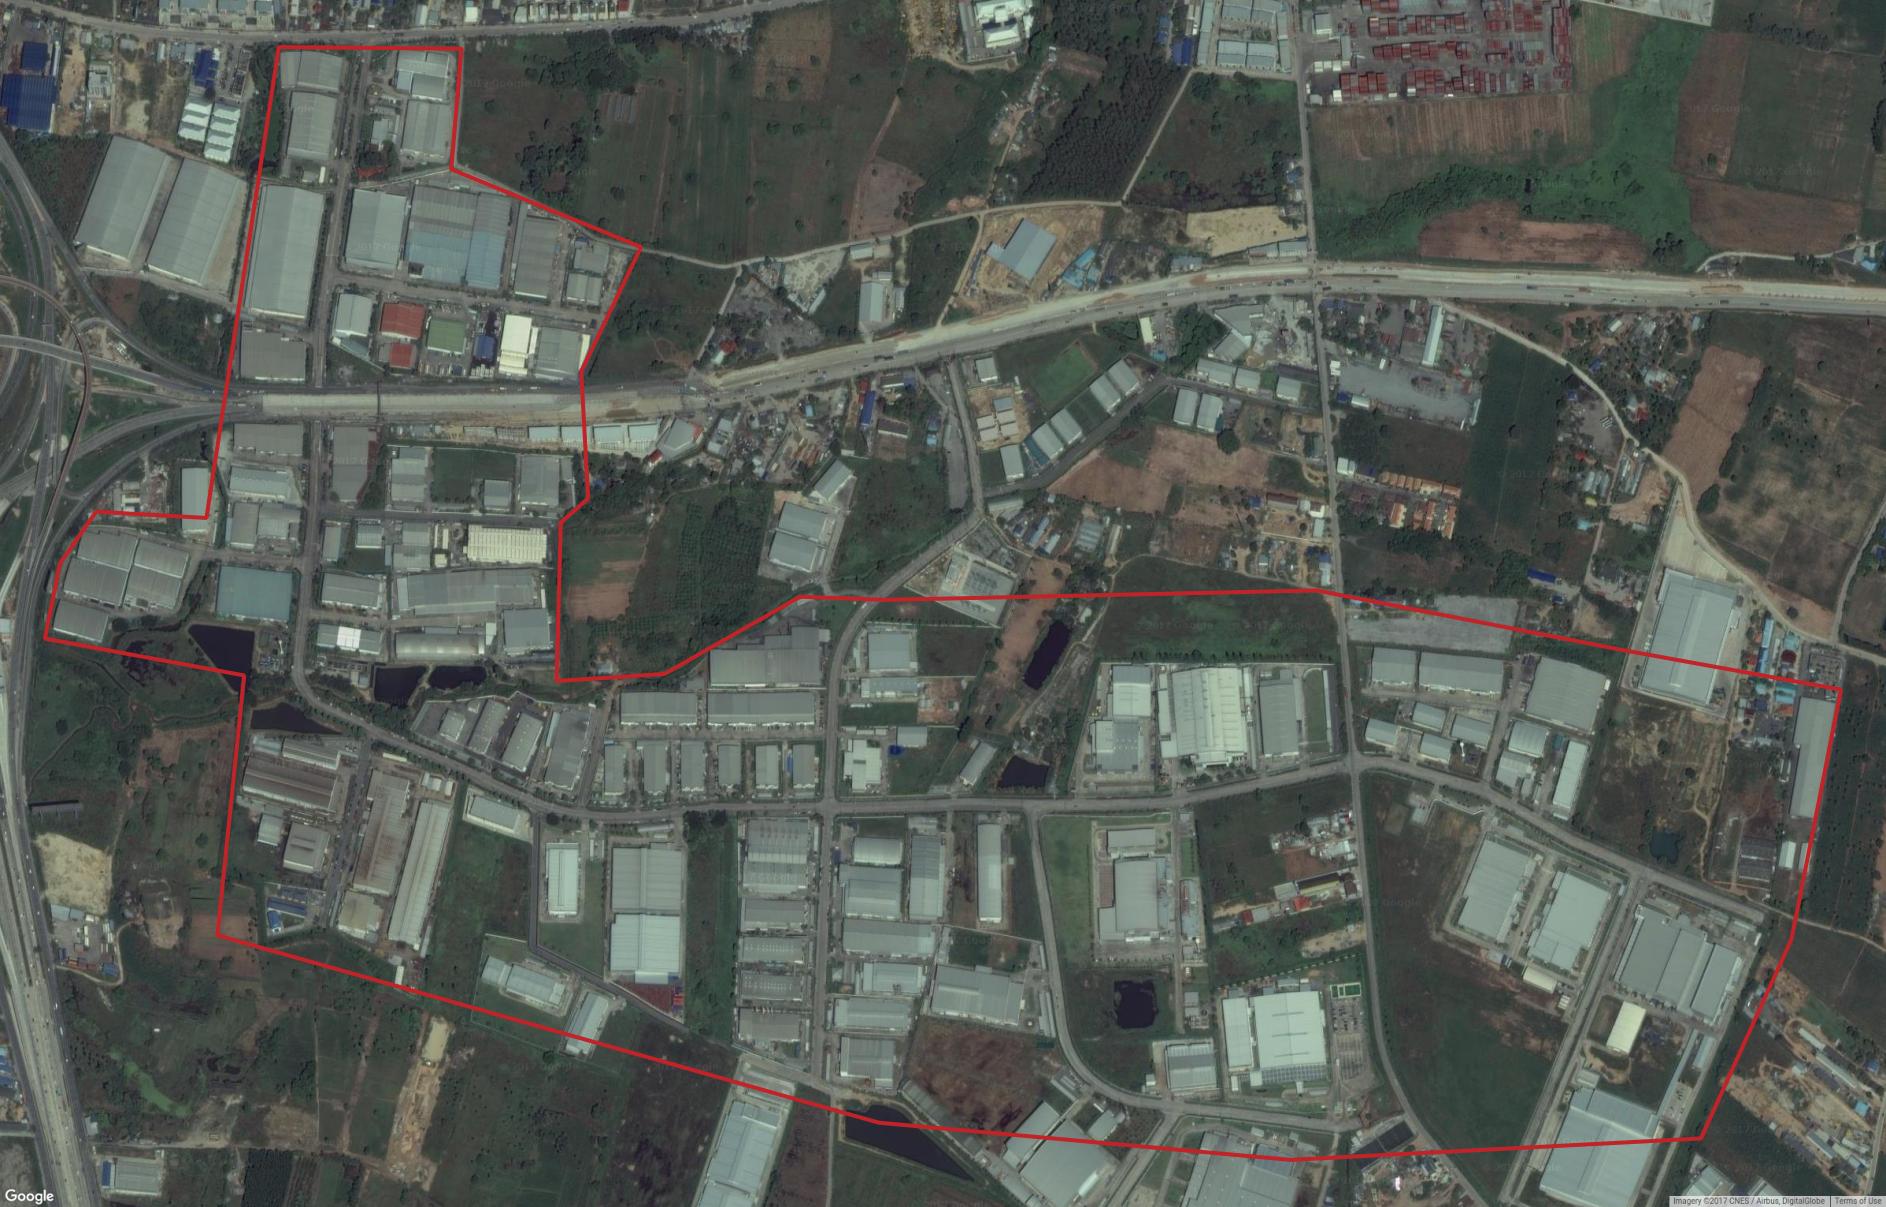
The Pinthong GIZ in Thailand is spread across 5 project areas with a total size of 960 hectares. This mosaic of industrial estates is located 10km north of Pattaya city, and approximately 40km south of Bangkok, and highly connected to local infrastructure, adjacent to a main arterial road (highway 7) and within 10km of the Laem Chabang Port. Each project area in the venture is set up as a miniature city in its own right with apartments, conference facilities, warehouses or small scale factories and commercial areas with a focus on sustainability with green areas allocated for plantation surrounding each project.
Major industries that exist across thes site include automotive (36%), steel (16%), plastic (9%), electronic (9%) and machinery (6%) with minor industries including logistics, food and drugs, packaging, chemical and petrochemical companies. Pinthong is continuing to invest in buying up further land and has applied for an IEAT status as a special economic zone alongside 4 other Thai industrial estates in mid 2017.
One of the aims of the target zone (covering 200 hectares) was to encourage foreign investment and introduce foreign expertise (with special permissions for foreign workers and exemptions on export duties) as well as support job growth. This main pinthong site is home to automobile, electrical and electronic investments.
- Size analyzed: 200 hectares
- Established: 1995
- Phase: Operational
Analysis
Pinthong is distinct amongst many SEZs, in that it’s success may well be more aptly measured in the economic expansion and socio-economic development of its accompanying “miniature cities”, rather than the impact on nearby cities themselves (in this case Bangkok and Pattaya). This reflects the focus of the SEZ not only to expand manufacturing, external international investment and job create, but do do so in a sustainable manner.
Here pollution analysis holds particular resonance, as success cannot be examined purely in terms of traditional macro-indicators - as our Phase I analysis shows, however, particulate levels have increased significantly over just the last two years. Increases are of course expected, especially given the other EO imagery indicators analysed, but given overall aims this remains a key concern.
While the Pinthong project was established in 1995, development continues to occur at pace - our decomposition of EO imagery into building footprint and land use classification rasters clearly indicates the rapid expansion of manufacturing capacity in the region. Building footprints have doubled since 2015, road network coverage is expanding at approximately 1km/year, and land-use classification clearly indicates the rapid industrial expansion. These micro-indicators tell a clear narrative of increased manufacturing capacity.
How this expansion has expanded on local communities, as well as the extent of broader impact on Bangkok and Pattaya are harder to assess. Again here CDR data, if made available, promises to paint a much broader socio-demographic picture, and its longitudinal analysis is likely to be illuminative given the continued development in the region over the last 10 years.
Given the proximity to Laem Chabang Port, and export-readiness of many of the goods being manufactured across Pinthong, this SEZ also holds the potential of a baseline analysis for understanding how to assess the impact of SEZ via novel data sources, and derived micro-indicators.
Land Classification
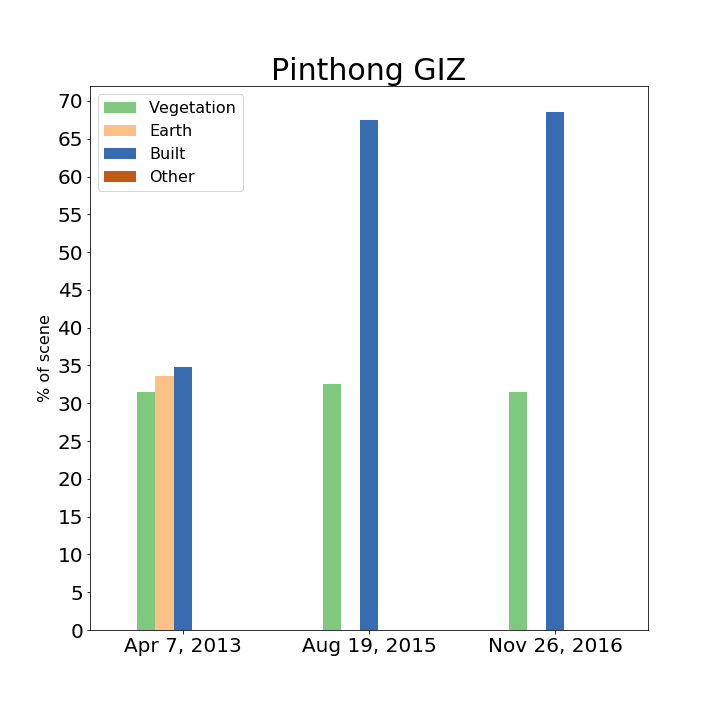
The images below span 3 years: 2013, 2015, and 2016, and show some development of earth into vegetation, then into built areas. The initial image from 2013 shows the zone after 18 years where vegetation is filled in with built area, then little changes from 2015 to 2016.
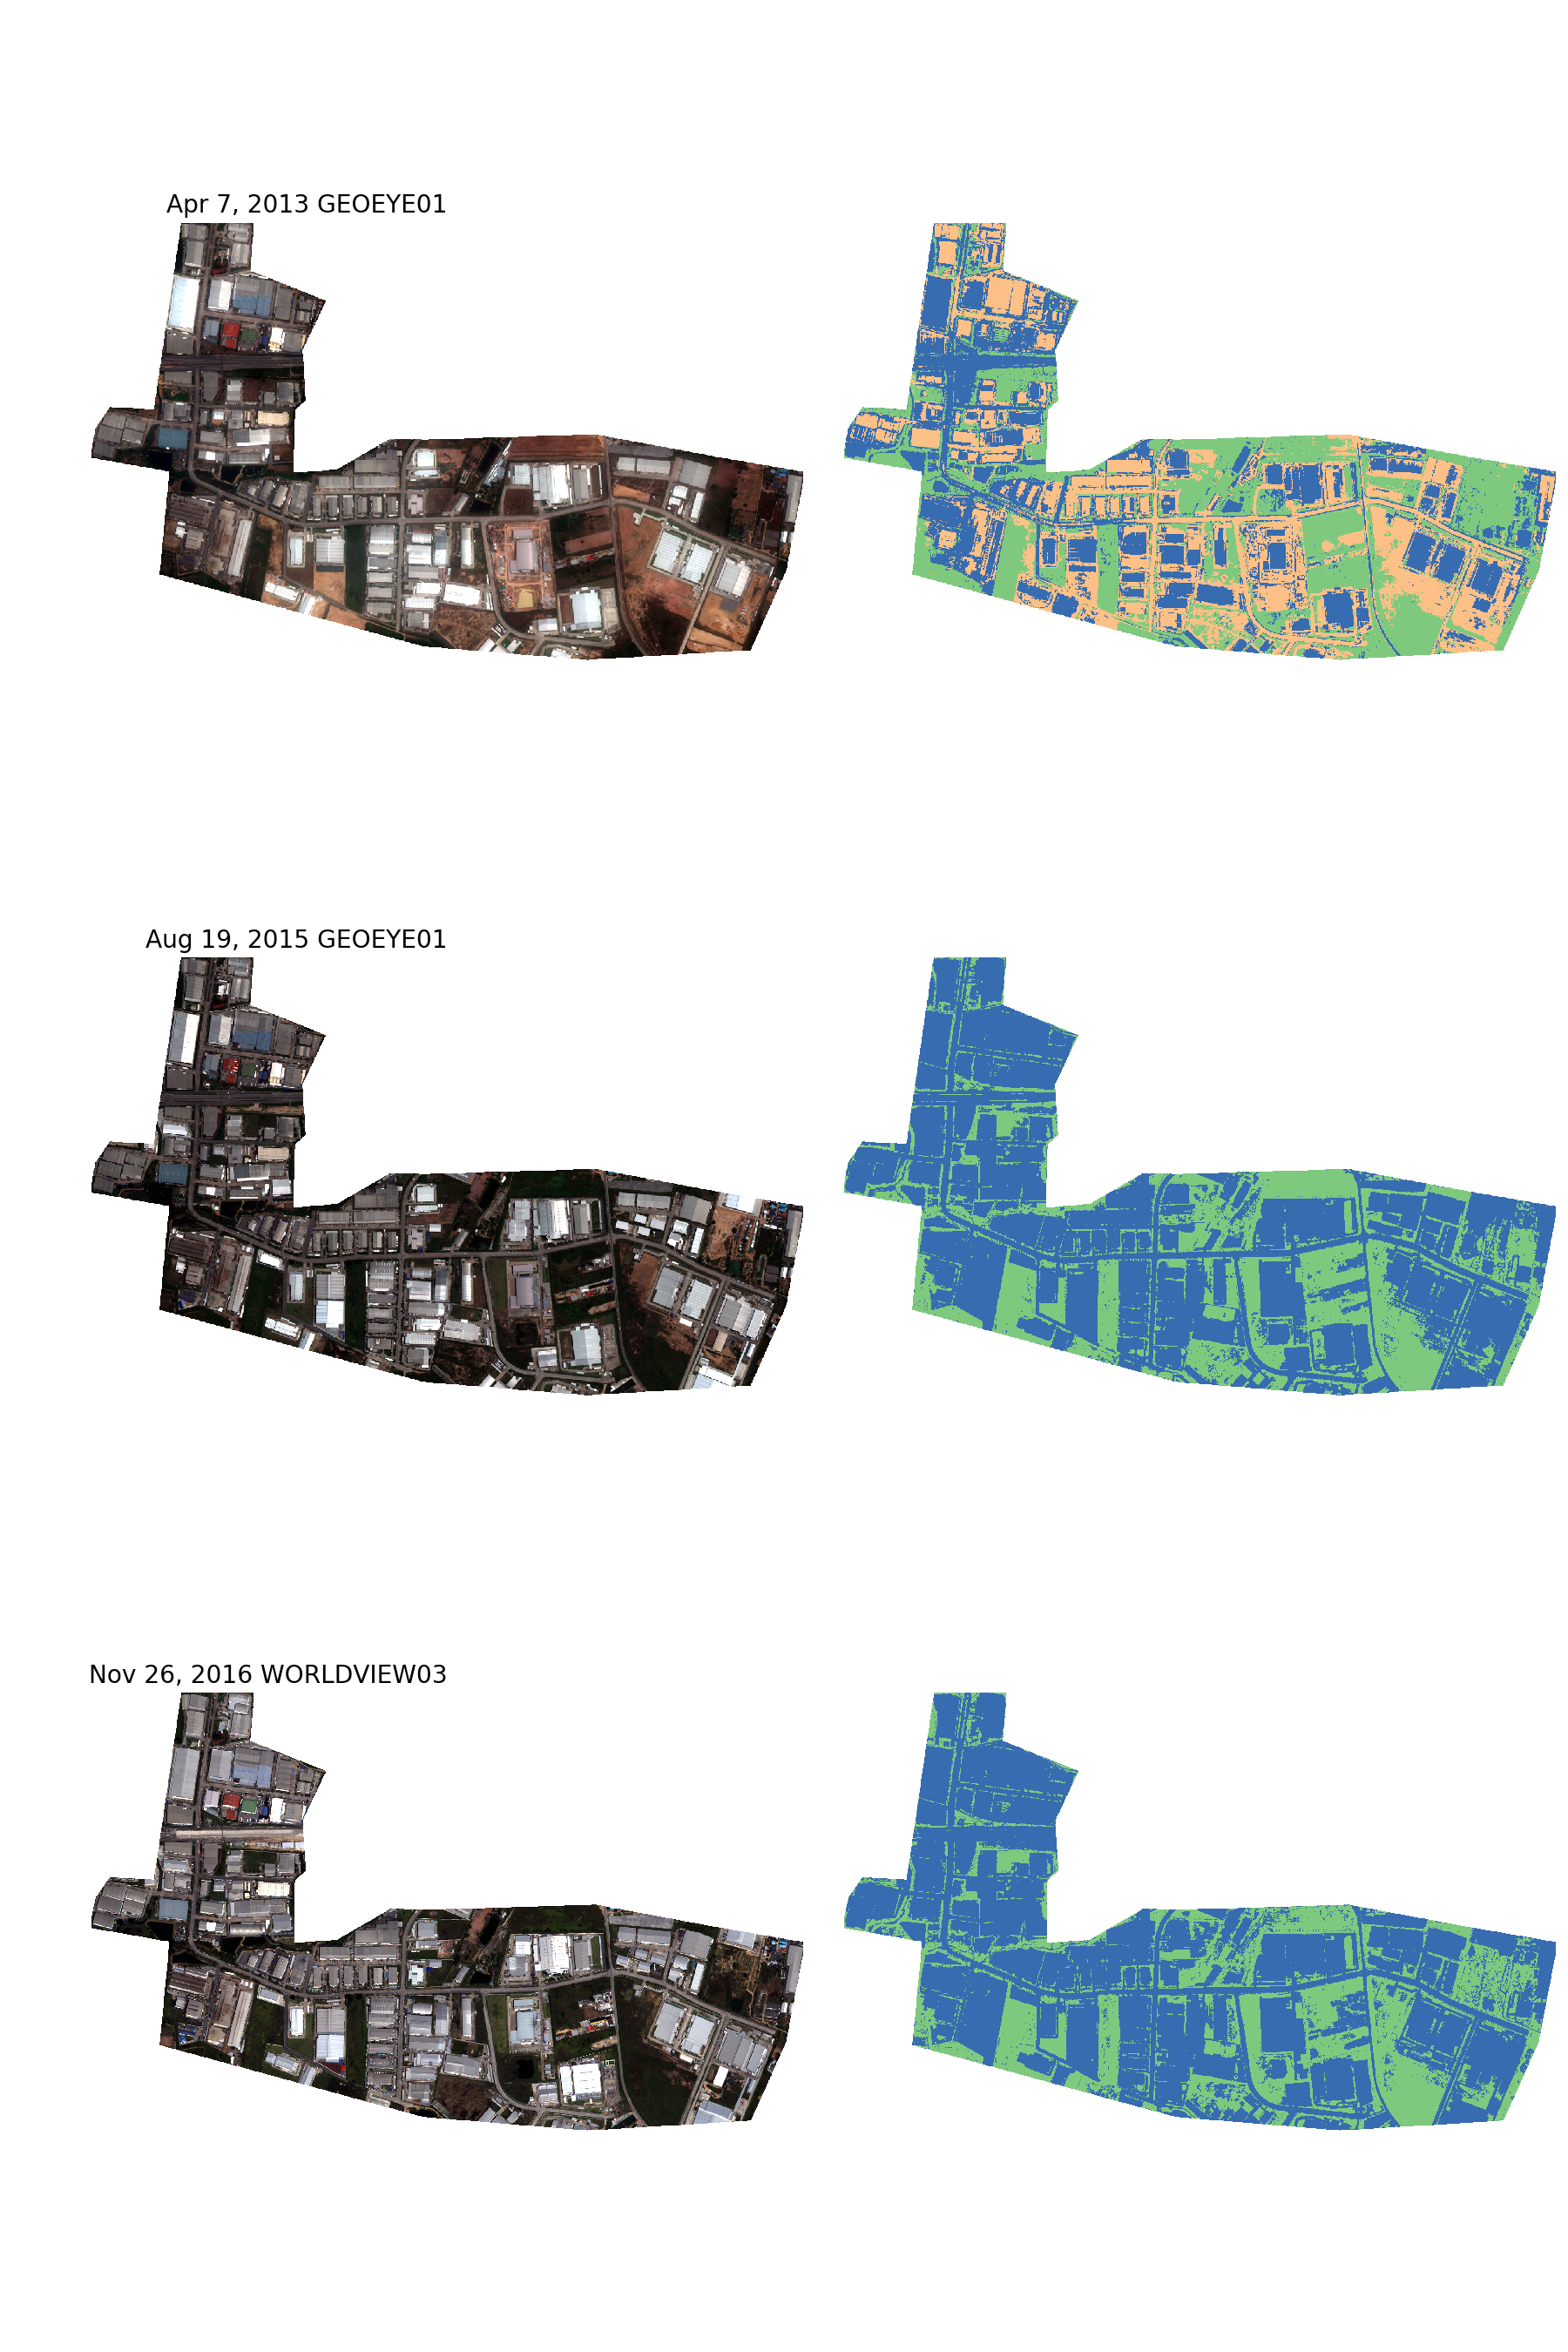
Like has been seen in the other zones, the clustering algorithm does a better job when there are fewer classes in the image. Here the buildings are mostly varying shares of gray, and the earth in the first image is of uniform color, while the vegetation is a really dark green. The percentages of classes is accurate, and correctly indicates little to no change from 2015 to 2016.
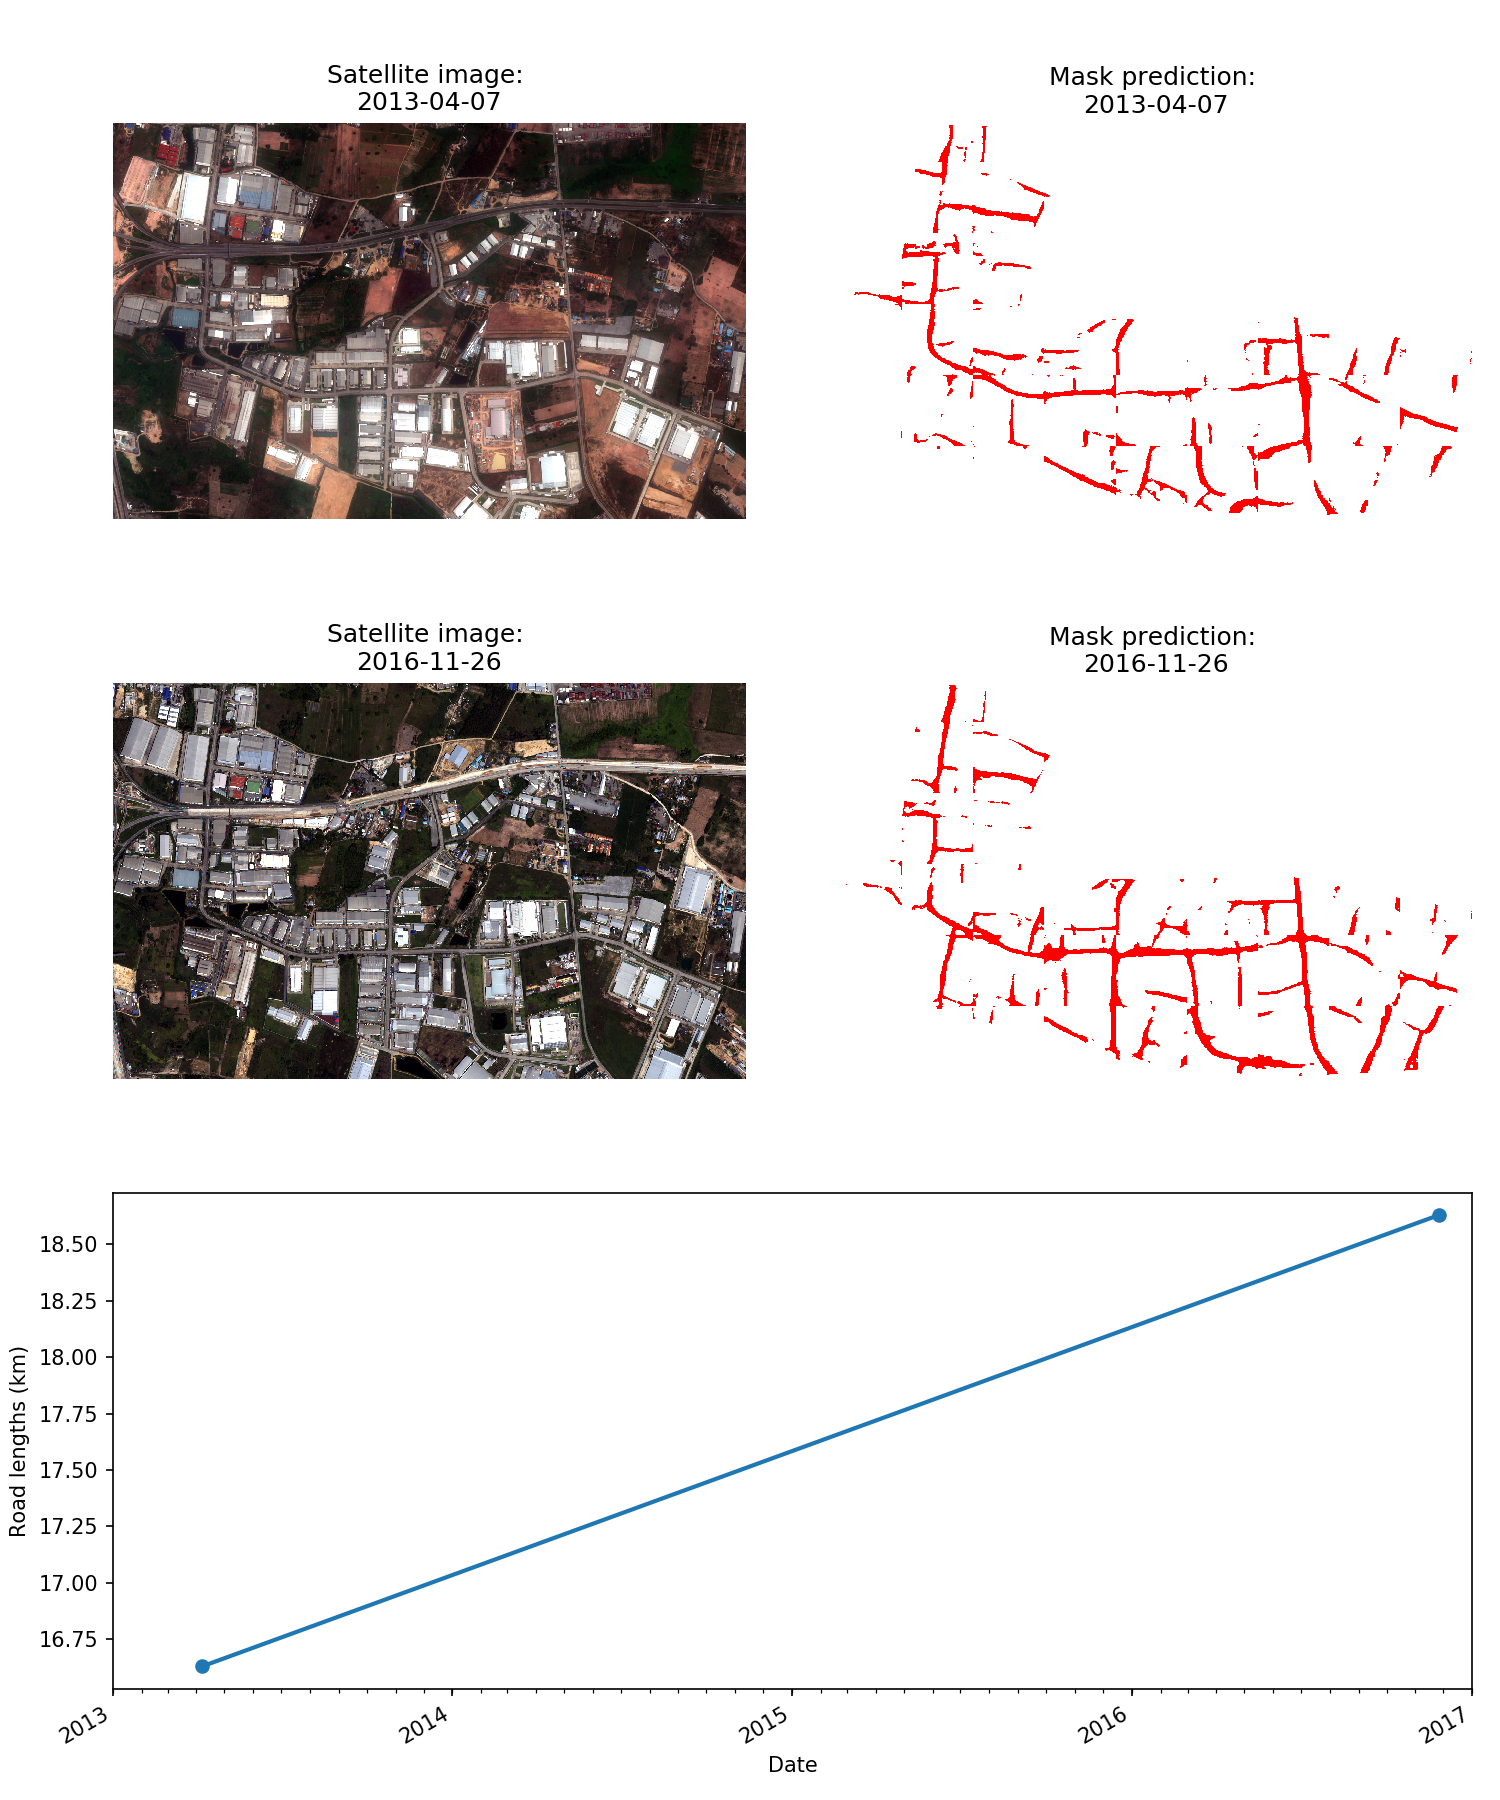
Transport Infrastructure
The total length of roadway (in km) was calculated using imagery from Digital Globe's Geoeye-01 and Worldview-03 satellites. Here, Skynet gives a reasonably good road mask that predicts a slight increase in roadway.
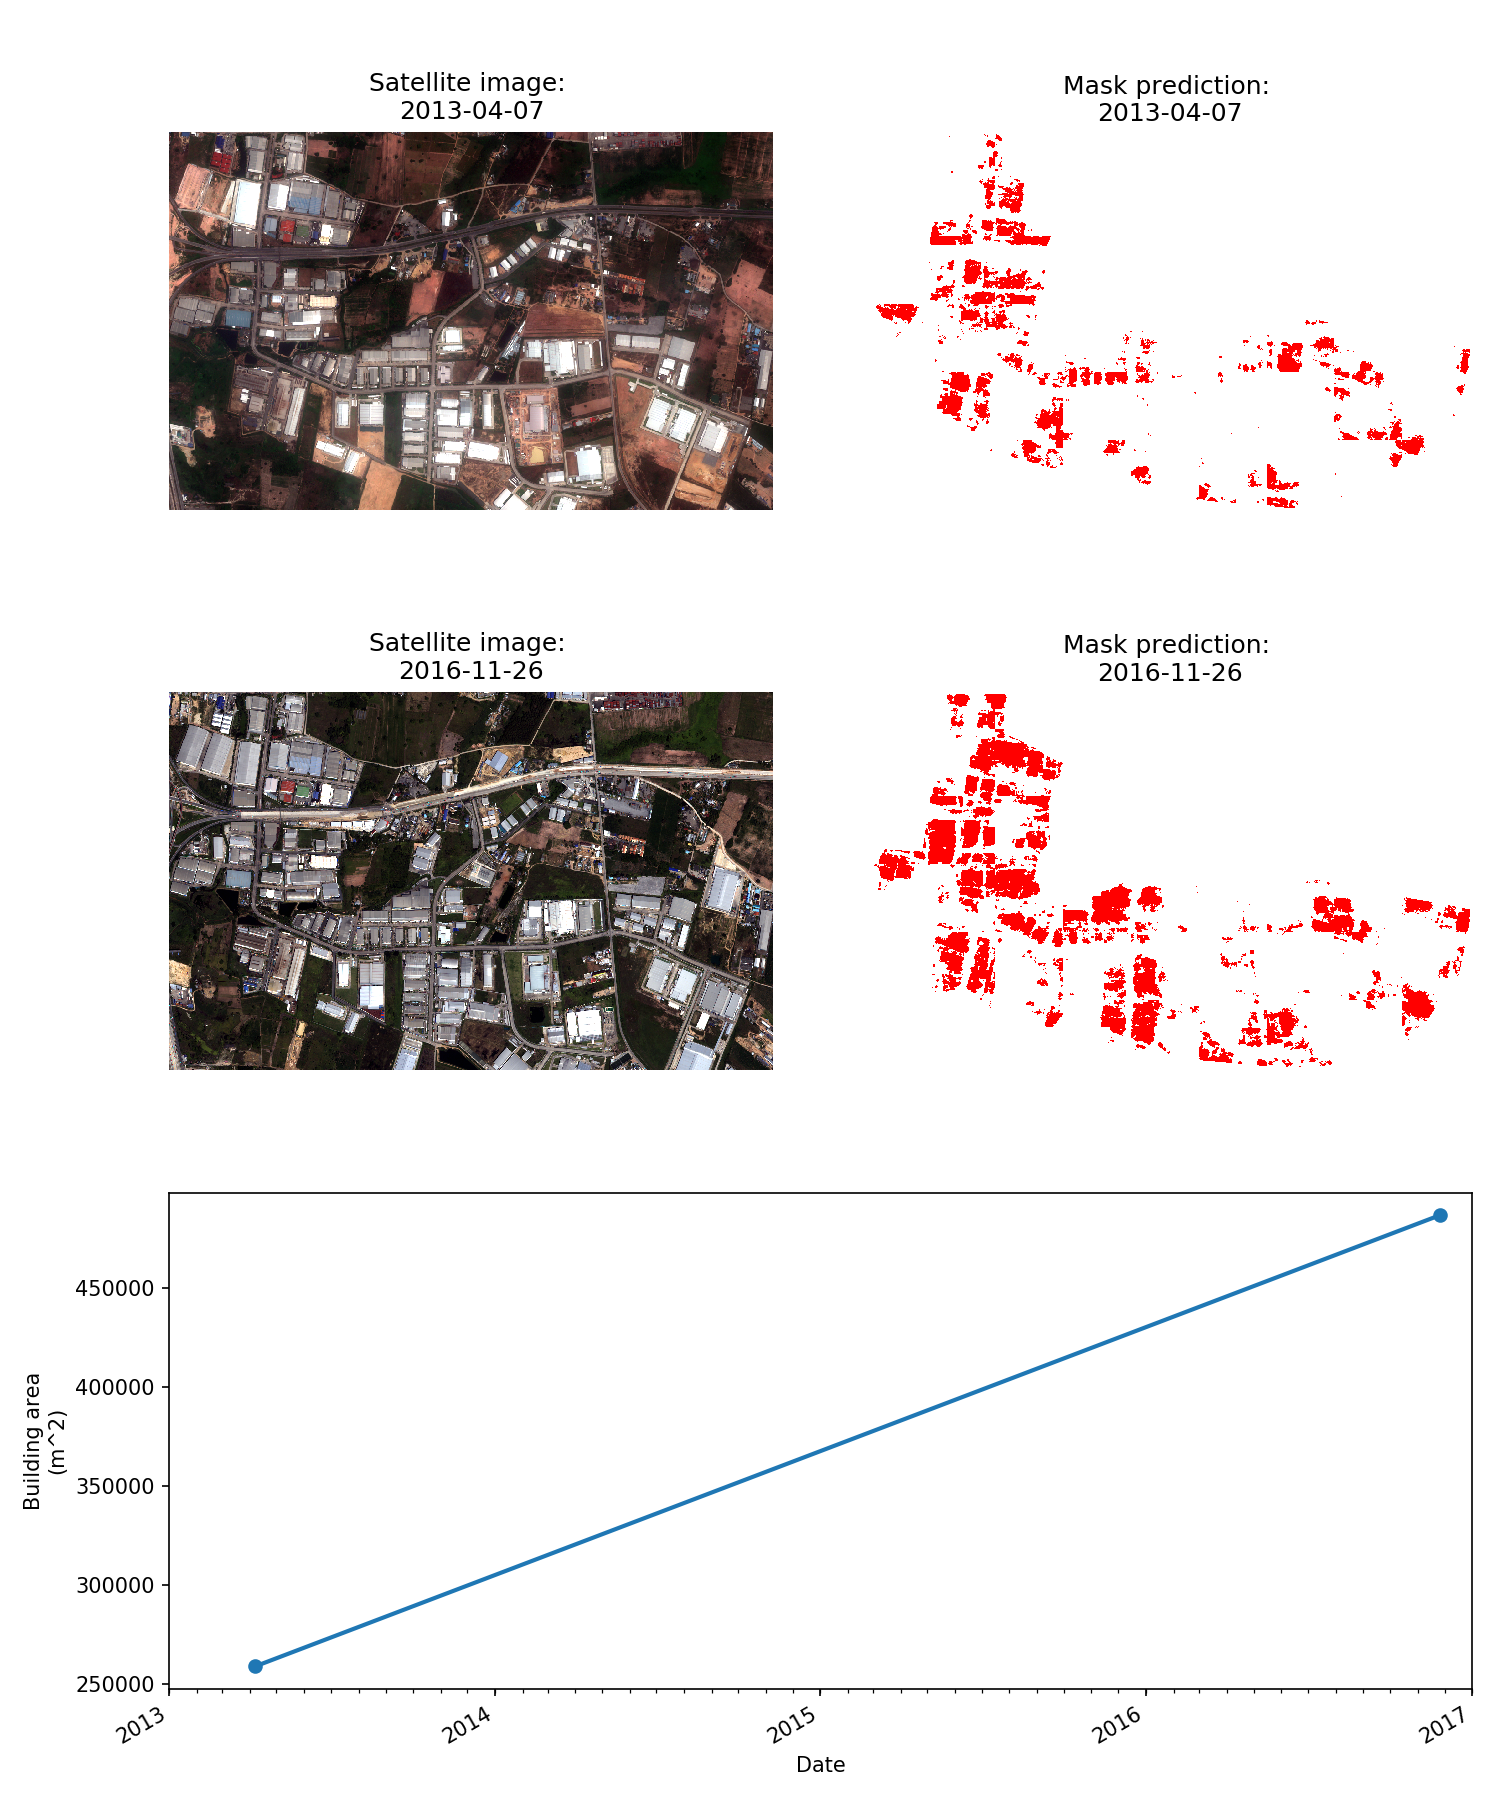
Building Footprints
The total building area (in m^2) was calculated using imagery from Digital Globe's Geoeye-01 and Worldview-03 satellites. Skynet gives reasonable segmentation results and correctly predicts an increase in the total building footprint. That said, there is still room for improvement as a number of structures were missed in the lower right portion of the zone. As with other scenes, this may be due to the Skynet model failing to identify buildings with white roofs.
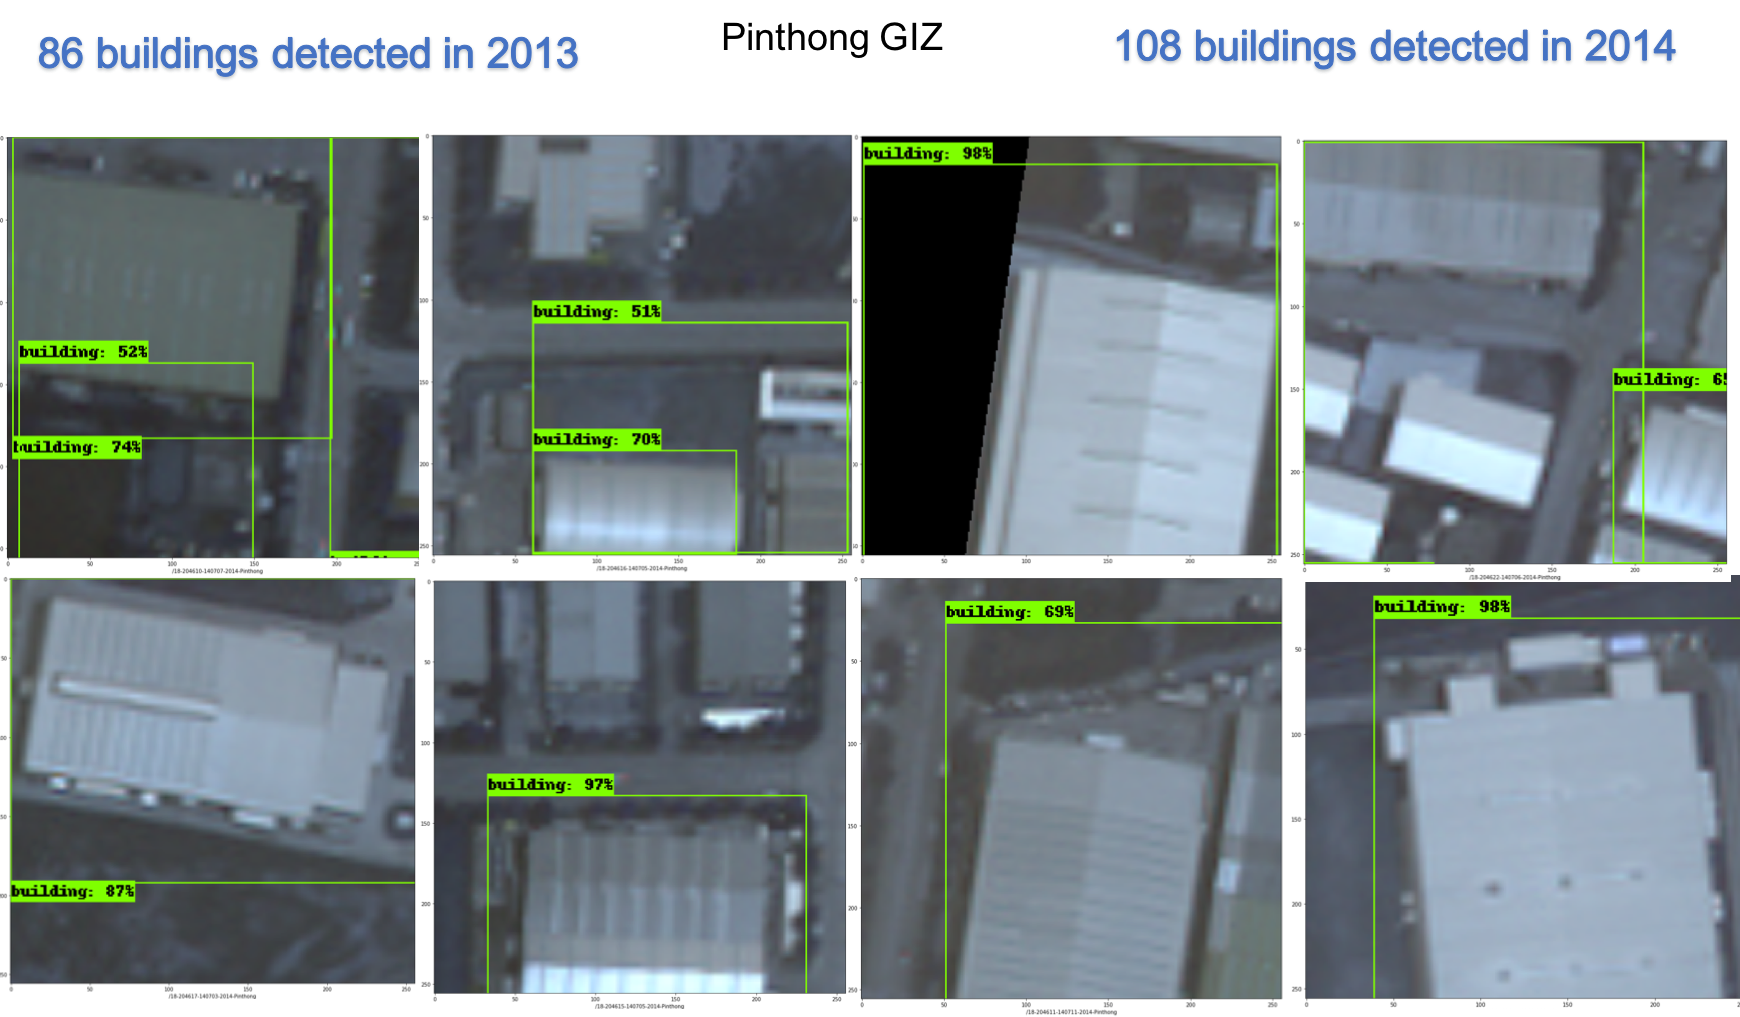
Building Counts
Even though the two Digital Global images for Pinthong GIZ in 2013 and 2014 are smoggy, Pinthong has pretty well-mapped building footprints as a well-operated SEZ site. Our object detection neural net was able to detect 86 buildings from the site in 2013 and 108 building in 2014.
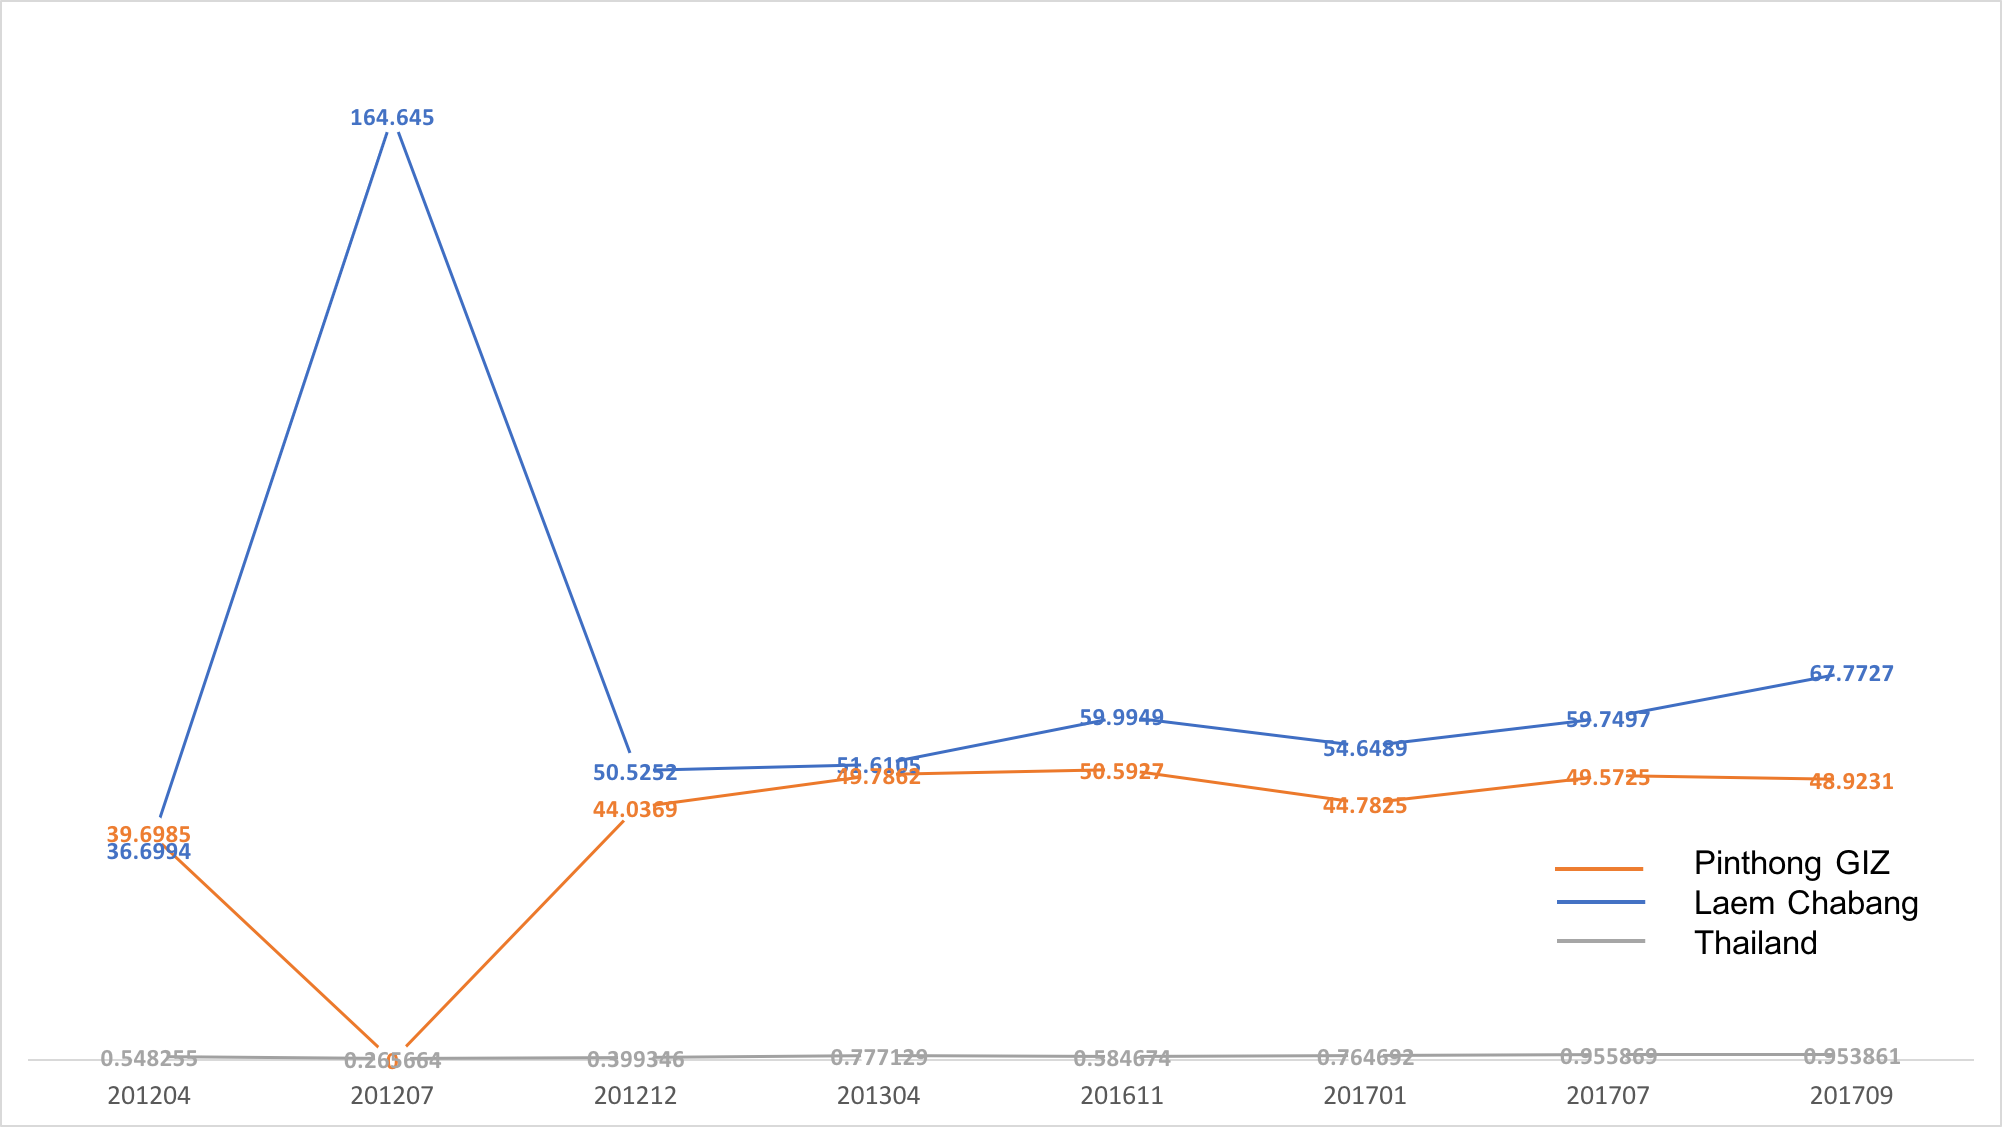
Electricity Consumption
Electricity consumption is highly correlated to a region's economic activity. To estimate electricity consumption, we used the Visible Imaging Radiometer Suite (VIIRS) Day/Night Band (DNB) imagery to correlate nighttime light radiance. Specifically, monthly VIIRS DNB product from The Earth Observations Group (EOG) at NOAA/NGDC was used.
As one of long-established SEZ sites, electricity consumption of Pinthong GIZ has exceeded the national level, but it slightly lower compares to its nearby city Laem Chabang.
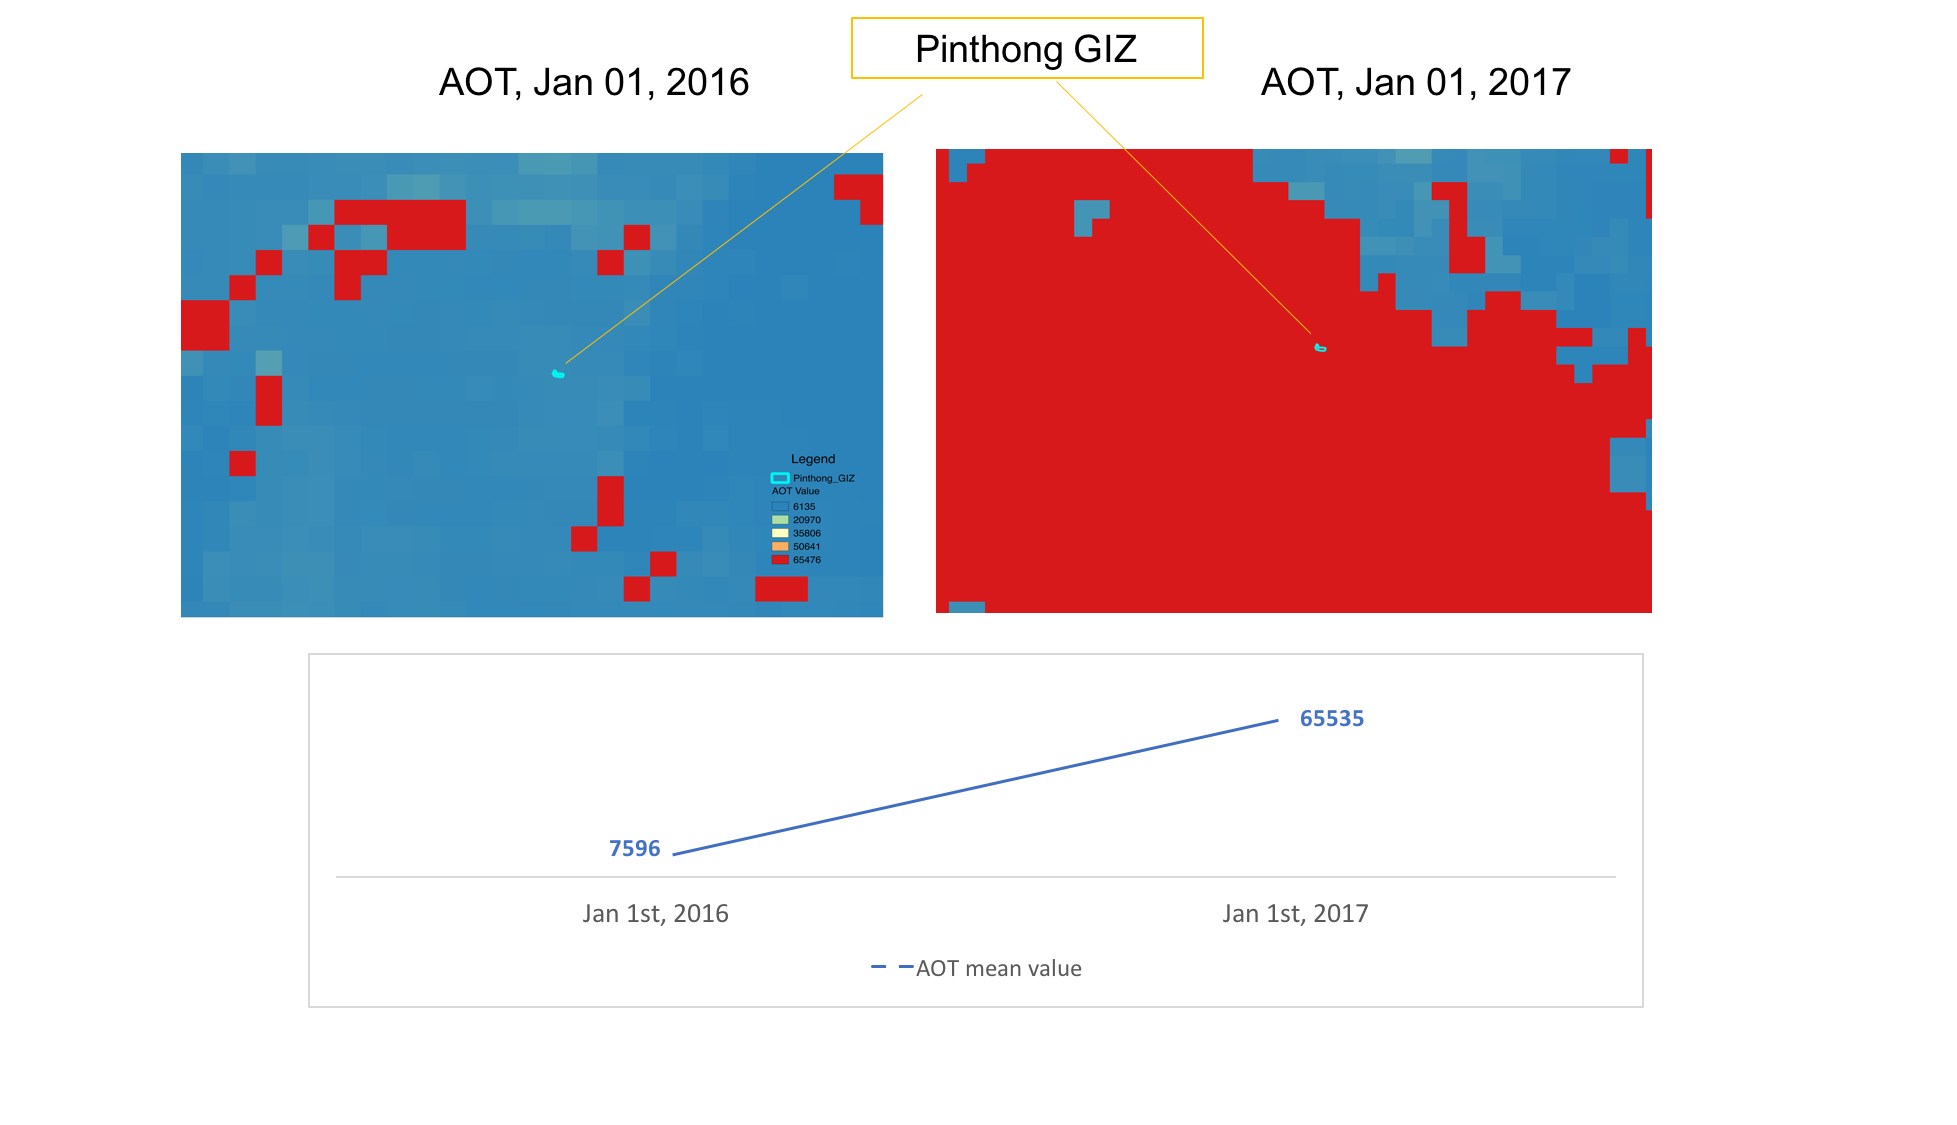
Pollution
Air quality and air pollution can also be monitored through VIIRS satellite imagery. Aerosol optical thickness (AOT) of VIIRS was obtained and processed as a proxy for air pollution indicator. Because it is related to the particulate matter, e.g. PM2.5, concentrations in the atmosphere, AOT is widely used for air quality and pollution applications. AOT imagery is recorded and updated daily at 6 km resolution.