Mapping
Mapping
Development Seed's Data team is among the best in the world at developing and improving map data. The Data team worked on several of the biggest and toughest mapping challenges, they mapped and edited more than 25 million objects in OpenStreetMap (OSM) and created routable road networks for the biggest names in navigation like Mapbox. The Data team has extensive experience with the OSM ecosystem, software stack, and metadata standards.
The Data team maps at an average speed and quality unparalleled in the industry. The average mapping time varies depending on the density and complexity of the features to map as well as the quality of the satellite imagery.
Here are some examples of the different types of mapping complexity that could impact mapping speed:
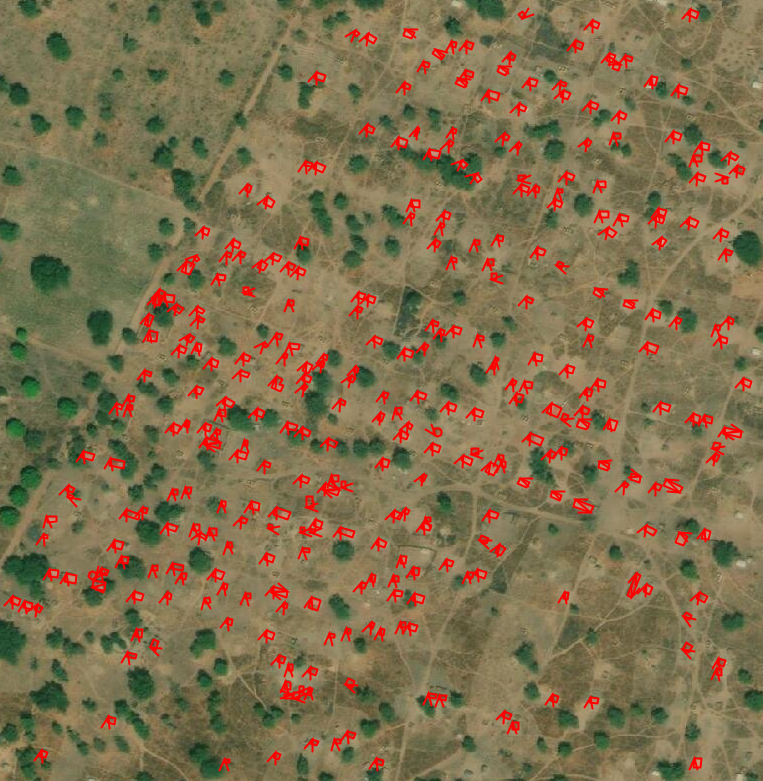
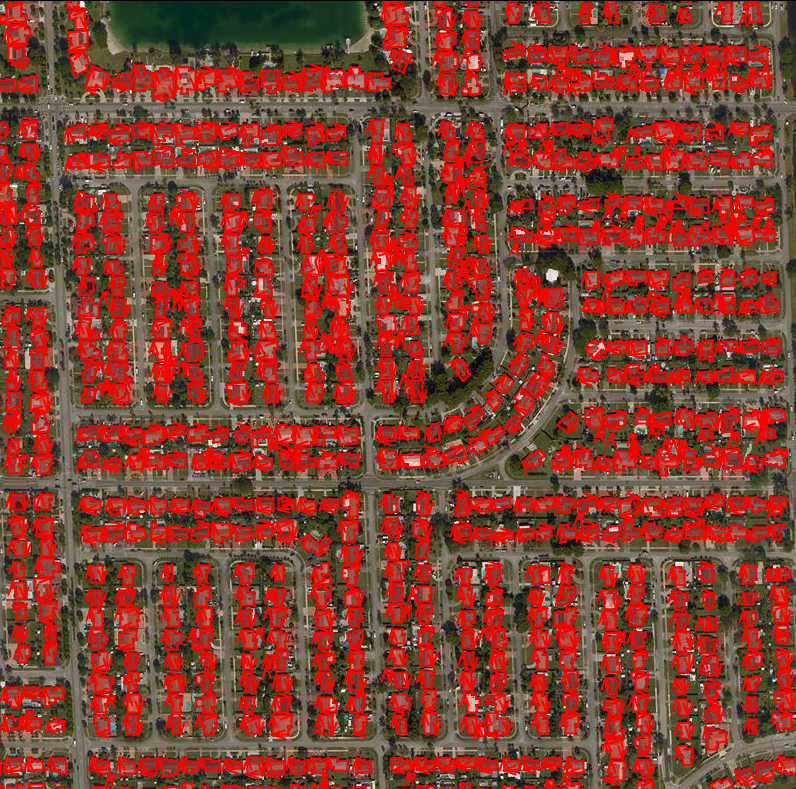
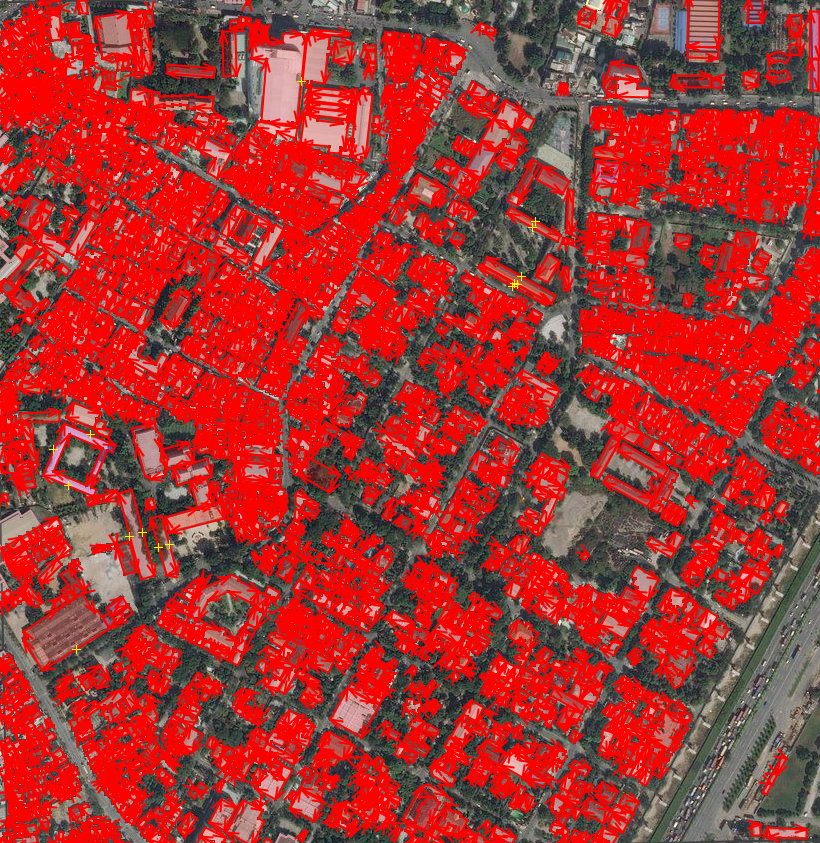
- Building:
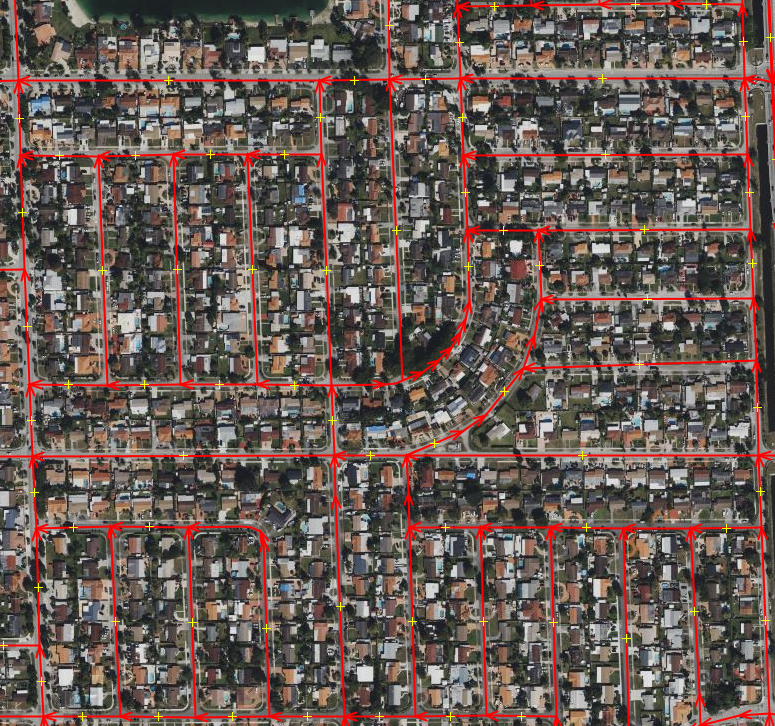
For mapping buildings, the Data team average mapping time varies according to the density of the buildings in an area. This density is classified as low, intermediate, and high.
| Low | Intermediate | High |
|---|---|---|
|
|
|
| Where there are only a few buildings. This density type can be seen in rural areas. | Where there are a lot of buildings. This density type can be seen in urban areas. | Where there are a lot of buildings, in addition, the buildings are well together. This density type can be seen in urban areas. |
The table below indicates the average mapping time of buildings per square kilometer.
| Density area | Area | Time (hour) |
|---|---|---|
| Low | 1km² | 0.67 |
| Intermediate | 1km² | 4 |
| High | 1km² | 10 |
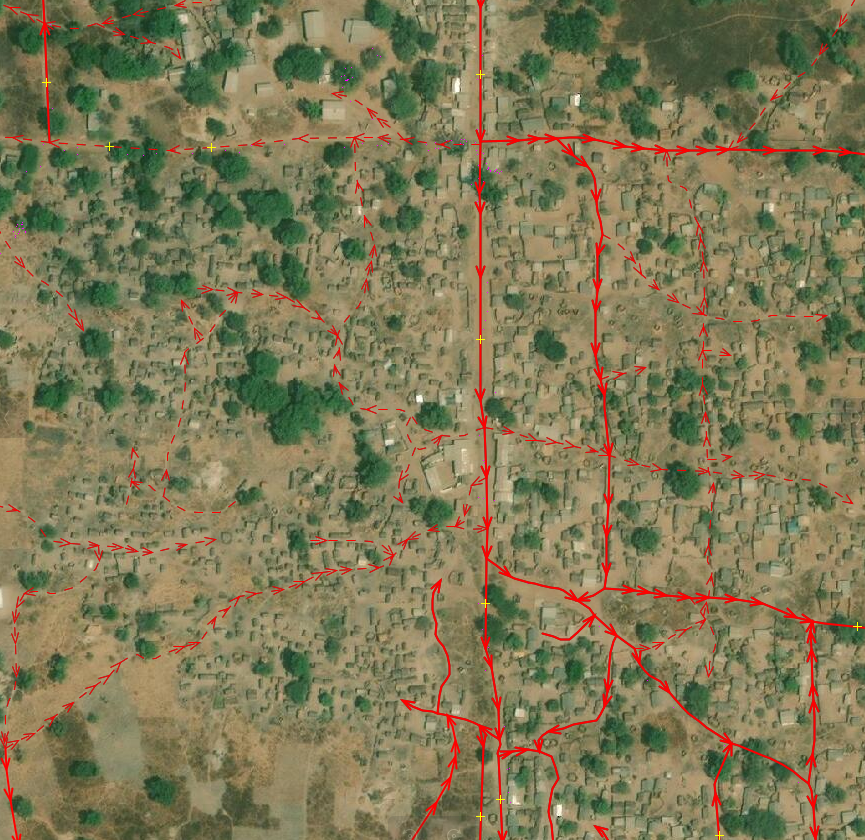
- Highway:
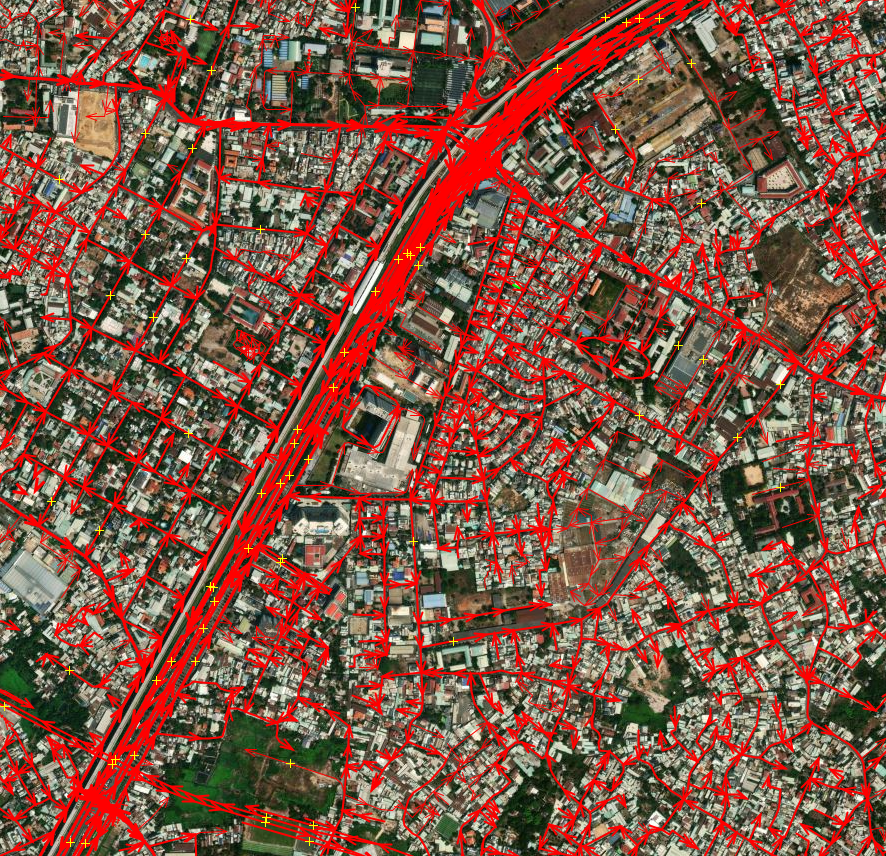
For mapping highways, the Data team average mapping time varies according to the density of the highways in an area. This density is classified as low, intermediate, and high.
| Low | Intermediate | High |
|---|---|---|
|
|
|
| Where there are only a few highways. This density type can be seen in rural areas. | Where there are several highways. This density type can be seen in urban areas. | Where there are a lot of highways. This density type can be seen in urban areas. |
The table below indicates the average mapping time of highways per square kilometer.
| Density area | Area | Time (hour) |
|---|---|---|
| Low | 1km² | 0.15 |
| Intermediate | 1km² | 0.25 |
| High | 1km² | 0.25 |
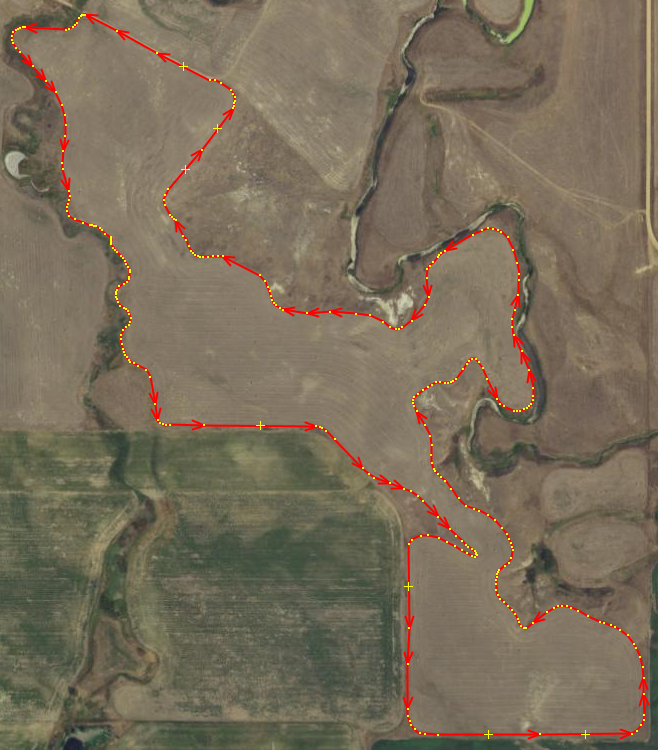
- Farm field:
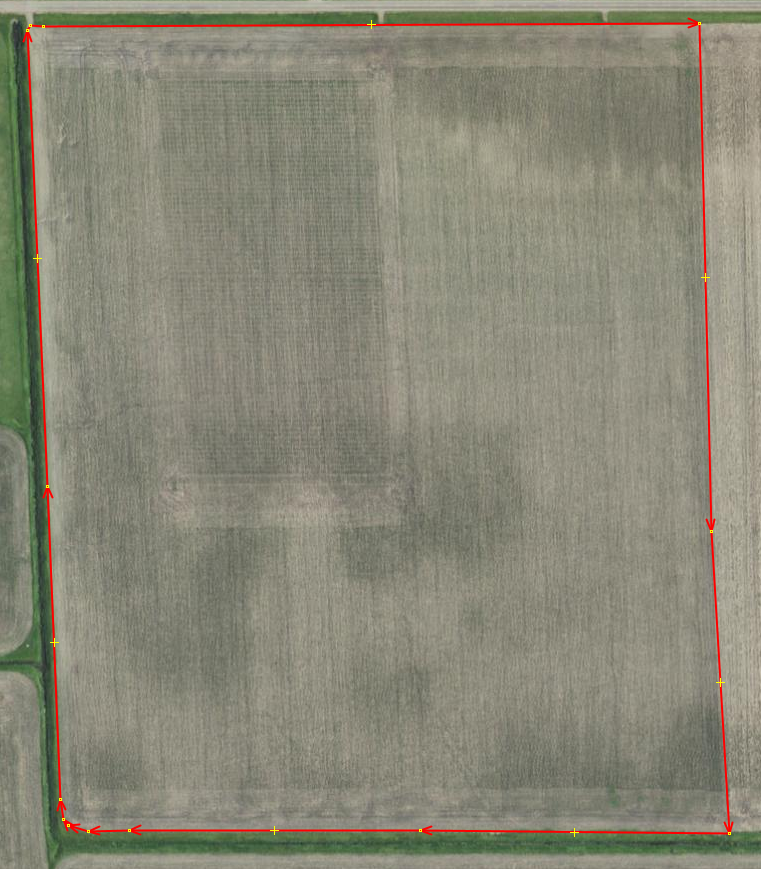
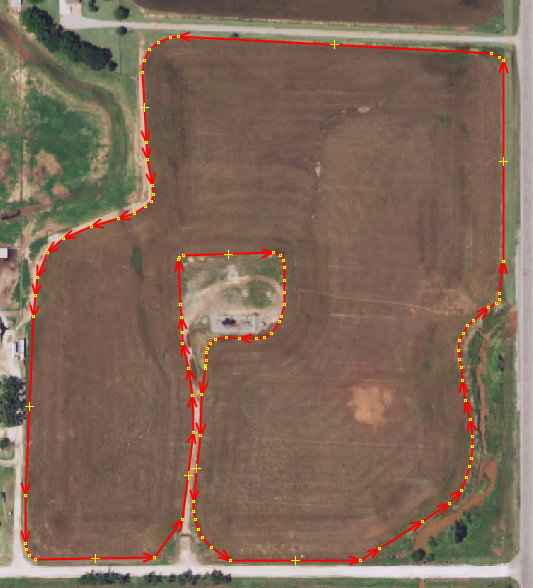
For mapping farm fields, the Data team average mapping time varies according to the farm field shape complexity. This shape complexity is classified as low, medium, and high.
| Low | Medium | High |
|---|---|---|
|
|
|
| Where the farm field shape is simple. | Where the farm field shape has a few edges. | Where the farm field shape has complex edges. |
The table below indicates the average mapping time of farm fields.
| Complexity | N° farm fields | Time (hour) |
|---|---|---|
| Low | 60 | 1 |
| Intermediate | 40 | 1 |
| High | 20 | 1 |
Data team's mapping tools
The Data team uses these tools for mapping:
- JOSM as an editor, where the Data team can do edits faster and easier.
- Tasking Manager, for dividing the AOI into small areas so each mapper can select a task and avoid conflicts.
- OpenStreetMap, a collaborative project to create free and editable maps.
Data team's mapping projects
The following list shows the mapping projects where the Data team has worked.