Introduction
Executive Summary
Lowland areas - those areas below 1500 m in altitude - comprise approximately 60% of Ethiopia’s territory. The lowlands are characterized by a high concentration of ethnic minority groups, regular conflict, and low population density. A significant portion of the population still maintain a nomadic or semi-nomadic, agro-pastoral way of life, and population dynamics in the region are not well understood. Conventional census methodologies and population surveys in the 212 woredas and 9 regions of the lowland Ethiopia are not sufficient for understanding urbanization patterns, population dynamics, and economic development trends in the region.
Satellite imagery enables the generation of unique insights into population dynamics and patterns of urbanization and economic development, at a scale that cannot be achieved using conventional survey techniques in isolation. By leveraging the information contained in satellite images, we are able to determine land use and land cover patterns across broad geographic regions, thereby contributing to a better understanding of a range of key development indicators. We used a range of satellite data sources of varying resolutions, in conjunction with other datasets, to elucidate changes in the extent of urban areas in lowland Ethiopia between 2000 and 2017. We also used a combination of satellite data to map large-scale commercial farms in the region. The introduction of these production systems into lowland Ethiopia, many of which are financed through foreign investments, represents a fundamental change to its agricultural sector and can be used as an additional indicator for understanding patterns of economic development in the region.
Prompt
The World Bank sought a rapid assessment of the entirety of lowland Ethiopia to measure the emergence of towns, urban settlements, and infrastructure in the region. This study would inform research for the Government of Ethiopia on lowlands resilience and development. Specifically, the analysis seeks to provide insights into levels of access to public services and human development outcomes in the country.
Methodology
To provide actionable insights into the land use and development patterns in lowland Ethiopia, we conducted a comprehensive geospatial analysis comprising multiple machine learning approaches. Our methodology and data sources were selected to track change between 2000 and 2017 in four areas:
- Built-up changes;
- Population dynamics;
- Nightlight light trends; and
- Large commercial farms and investments.
We used multiple earth observation (EO) data sources, including satellite imagery of varying resolution, to examine changes in urbanization and built-up areas, and for the detection of large commercial farms. For specific tasks, we performed various data concordance operations to generate consistent, comparable datasets. Where possible, we leveraged open data from VIIRS, Sentinel, and Landsat. Certain analytical procedures required the use of supplemental commercial imagery, incorporation of high-resolution imagery for data validation and quality assurance, and use of Landscan population density data to identify patterns of population dynamics across the lowlands.
Built-up changes
We developed a machine learning pipeline utilizing Landsat 7 and 8 satellite image datasets to detect changes in built-up areas in the lowland Ethiopia. Ethiopia presents unique challenges to building an automated detection pipeline for the built-up area using Landsat satellite images:
- Ethiopia is a large country (1.1 million km2) with highly variable landcover and terrain types;
- Individual buildings are smaller than a single 30m x 30m Landsat pixel. The majority of built-up pixels are, therefore 'mixed', containing building, vegetation, and soil; and
- Many roads are unpaved and present a similar spectral signature to bare soils.
To address these challenges, we developed an analysis pipeline rising multiple machine learning approaches, including supervised and unsupervised learning algorithms, to predict changes in the built-up area between 2000 and 2017.
Population dynamics
Changes in population density through time in lowland woredas were analyzed using the Landscan dataset.
Night-time light trends
We used DMSP and VIIRS image sources to reconstruct nightlight trends and measure changes between 2000 and 2017 in lowland Ethiopia. We developed a semi-automated workflow to composite and inter-calibrate the VIIRS and DMPS images into a homogeneous annual dataset covering the period from 2000 to 2017.
Large commercial farms
We used multiple satellite sources in order to map large commercial farms in Ethiopia. We relied primarily on a Sentinel-2 false-color mosaic layer for farm identification, mapping and utilized other high-resolution satellite imagery sources as a cross-reference when plot boundaries were not apparent in the Sentinel-2 scenes.
Our expert mappers have created highly detailed maps of over 190 commercial farms across the lowlands, corresponding to nearly 340,000 ha of total land area. Each of these farms was added to OpenStreetMap (OSM), with individual plots being traced with a high level of detail and accuracy. In addition to the tracing, our team has also compiled information about the investors associated with these activities. A commercial farm visualization tool was developed that combines all of geographic and investor information. This tool contains all mapped farmlands and shows high-level investor information at the woreda level.
Key findings
When viewed together, trends in the built-up area, nightlights, and population dynamics between 2000 and 2017 in lowland areas of Ethiopia support a pattern of urbanization in the region.
A cross-examination of population density growth, night-time light, and built-up area trends revealed strong patterns of urbanization in Afar, SNNPR and Dire Dawa regions. In contrast, Somali region in southeast Ethiopia has experienced little in the way of urbanization or population growth over the past 17 years. Afar also contained the largest number of commercial farming operations among the lowland regions, followed by SNNPR.
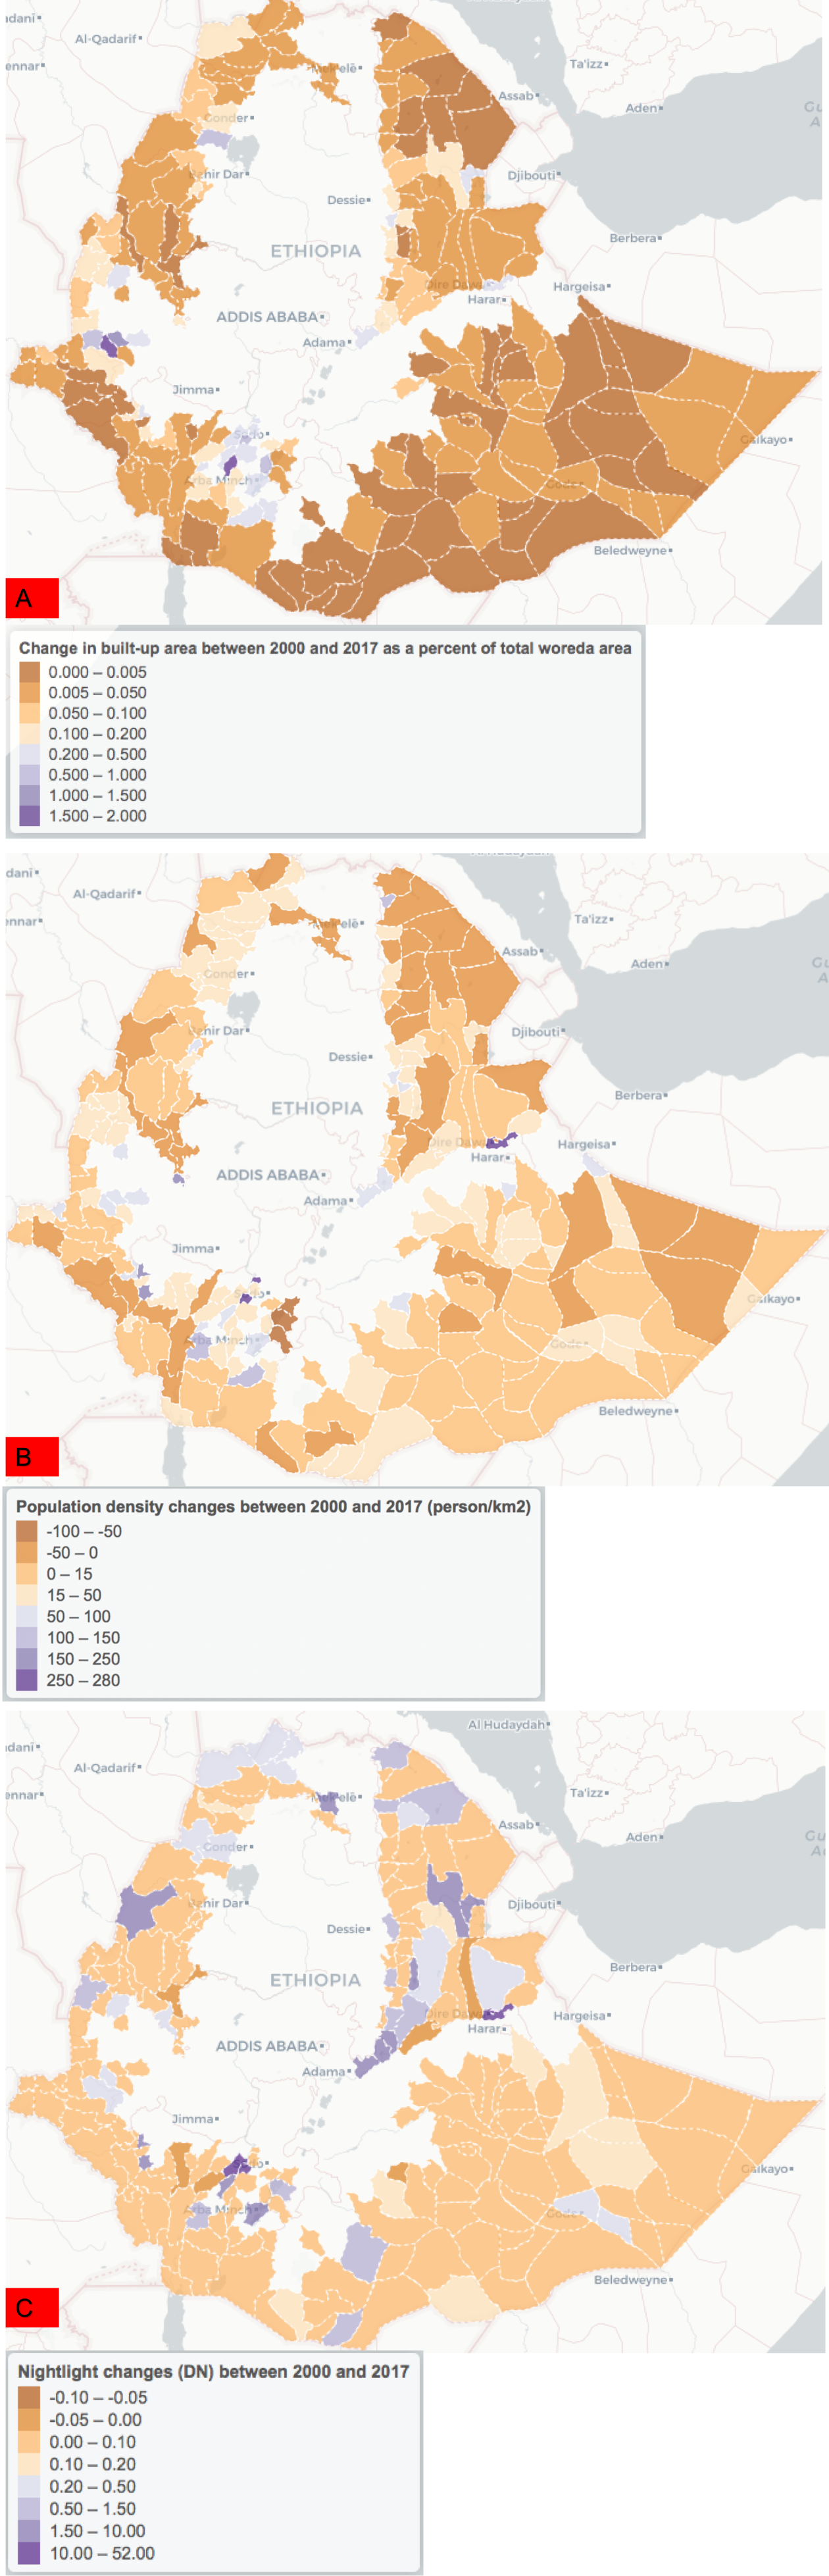
Our primary findings are summarized in the following image showing: A) Change in built-up area as a percentage of woreda area between 2000 and 2017 (a full analysis of built-up change can be viewed in this online notebook; B) Change in population density between 2000 and 2017, see the notebook and C). Nightlight trends (in DN value) between 2000 and 2017 in the notebook.
Our technical approach and key findings are divided into the following sections:
- Built-up changes;
- Population dynamics;
- Nightlight trends; and
- Large commercial farms and investments.
Built-up changes
All nine lowland regions experienced an increase in built-up area between 2000 and 2017. Dire Dawa, SNNPR, and Afar experienced the largest proportional increases in the built-up area during the study period. In absolute terms, SNNPR, Oromia, and Afar regions showed the most significant change in the built-up area, with increases of 3990, 3152, and 2669 ha, respectively.
Somali region, occupying a large area of southeast Ethiopia, experienced very little increase in the built-up area during the study period as a proportion of the region area.
Population dynamics
We found that trends in population density from 2000 to 2017 align with our predicted change in the built-up area. Population density and built-up area increased in the southeast of the country, including the SNNPR region as well as in the in the southwestern regions of Afar and Dire Dawa. Areas in central Ethiopia near Addis Ababa also showed high increases in population density.
Dire Dawa region, in particular, experienced substantial population growth of over 250,000 from 2000 to 2017. Several woredas in SNNRP region experienced population increases of over 100,000 during the study period. Surprisingly, while many woredas in Afar region experienced population growth e.g. Boset, and Fentale, many woredas in northern Afar experienced negative population growth over the same period.
Night-time light trends
An analysis of trends in nightlight data in Lowland Ethiopia from 2000 to 2017 supports our finding of built-up a population dynamics trends for the region. Those regions with high levels of predicted increases in built-up area and that experienced high levels of population growth also tended to show an increase in illumination over the study period. Afar, Dire Dawa, and SNNPR experienced the most significant increases in nightlight illumination over the study period.
Several lowland woredas stood out as having particularly large increases in nightlight levels, including Dubti and Aysaita in Afar region, and Dire Dawa and Dire Dawa Town in Dire Dawa region. This suggests that these areas experienced high levels of urbanization and possibly increased industrial activities over the past two decades.
Large commercial farms
Afar region, in addition to experiencing a large increase in built-up area and nightlight activity, contained the largest commercial farm area with more than 85,000 ha lands under large-scale agricultural cultivation. SNNPR, Gambela and Tigray regions also showed a large amount of land dedicated to commercial farming activities. The arid Somali region contained the least amount of commercial agricultural area.