Results
Large commercial farms
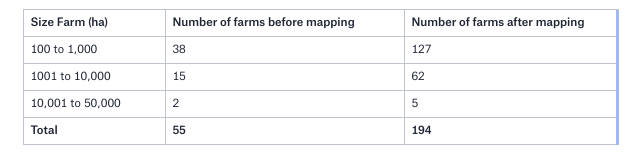
Our expert mappers have created highly detailed maps of over 190 commercial farms across the lowlands, corresponding to nearly 340,000 ha. Each of these farms was added to OpenStreetMap (OSM), with individual plots being traced with a high level of detail and accuracy. We found:
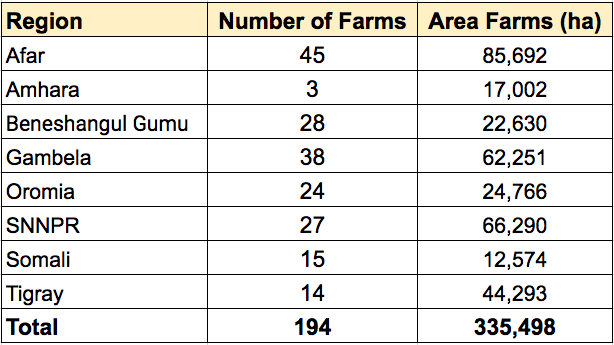
- Afar region attract the largest commercial farms investments with more than 85,000 ha lands are assigned for large-scale agricultural cultivation.
- SNNPR, Gambela and Tigray regions are following Afar of the large farm investments;
- Somali is the least invested region in the lowland Ethiopia.
The detail mapped farms at regional level as follows.
In addition to the tracing, our team has also compiled information about the investors behind these activities. Our intention was to link this data to individual farms and add it to OpenStreetMap, but we lacked the information to do so. Instead, we are providing the information in tabular format, with investments associated to individual woredas.
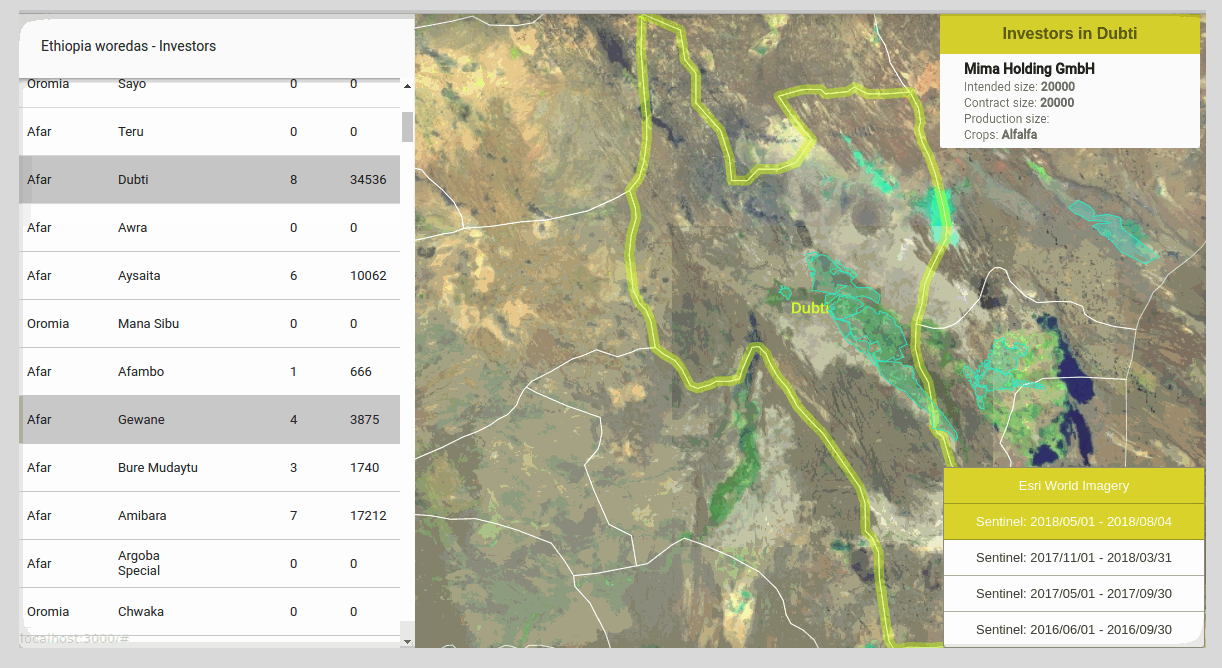
A visualization tool that combines all this information in the commercial farm visualization tool (see above image): This tool highlights all the farmlands and shows high-level investor information at the woreda level. It also allows you to visualize the Sentinal-2 imagery that we used during the mapping process too.