Results
Nightlight trends
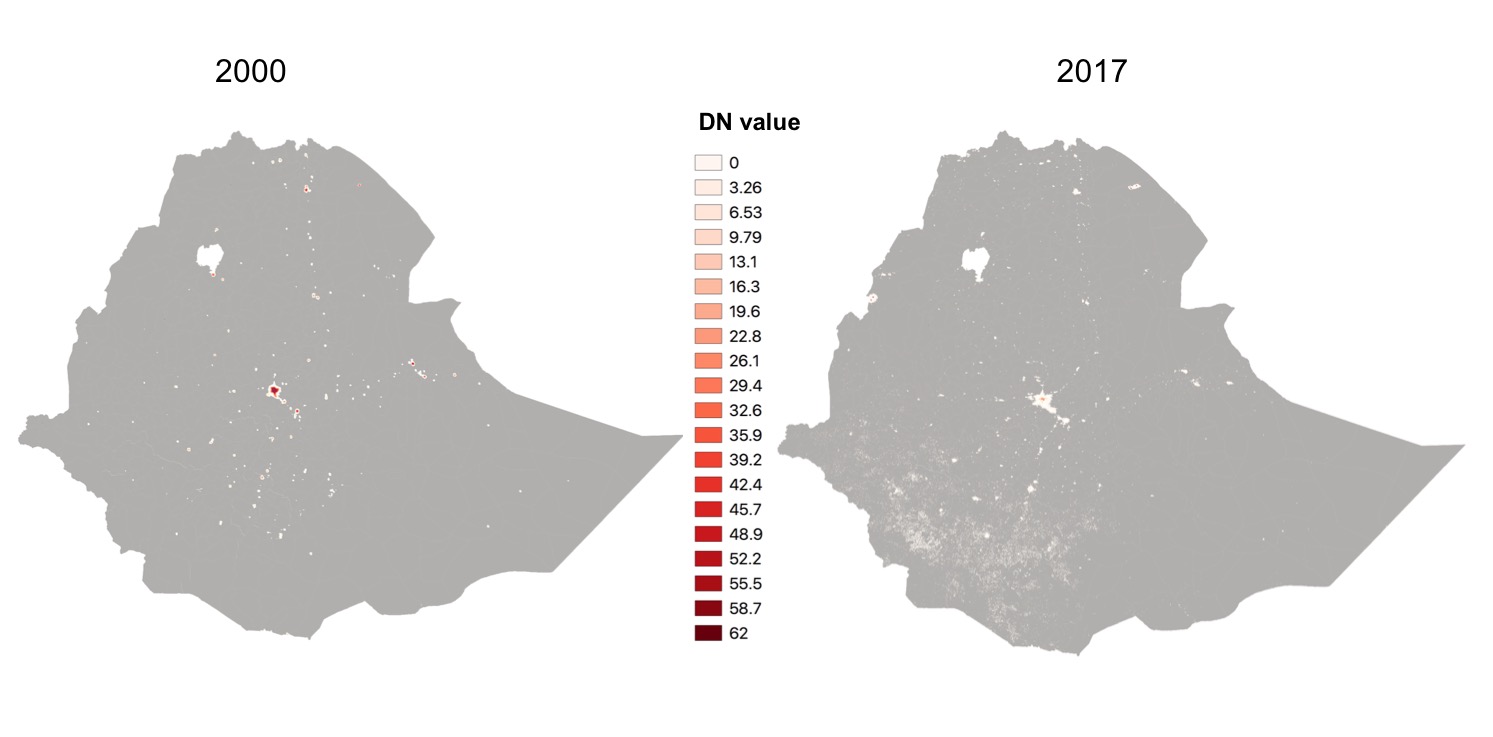
Few findings over nightlight changes between 2000 and 2017:
- DMSP OLS nightlight is over-saturated compares to VIIRS; That's the reason we see nightlight 2000 is darker visually compared to VIIRS in general (first figure);
- VIIRS nightlight (2014 - 2017) is collected around 1:30 am local time, and can be a proximate indicator for industrial and economic electricity consumption for a region; However,
- DMSP nightlight (2000-2013) is collected around 7:30 pm local time, it reflects residential, industrial as well as economic activity on the ground.
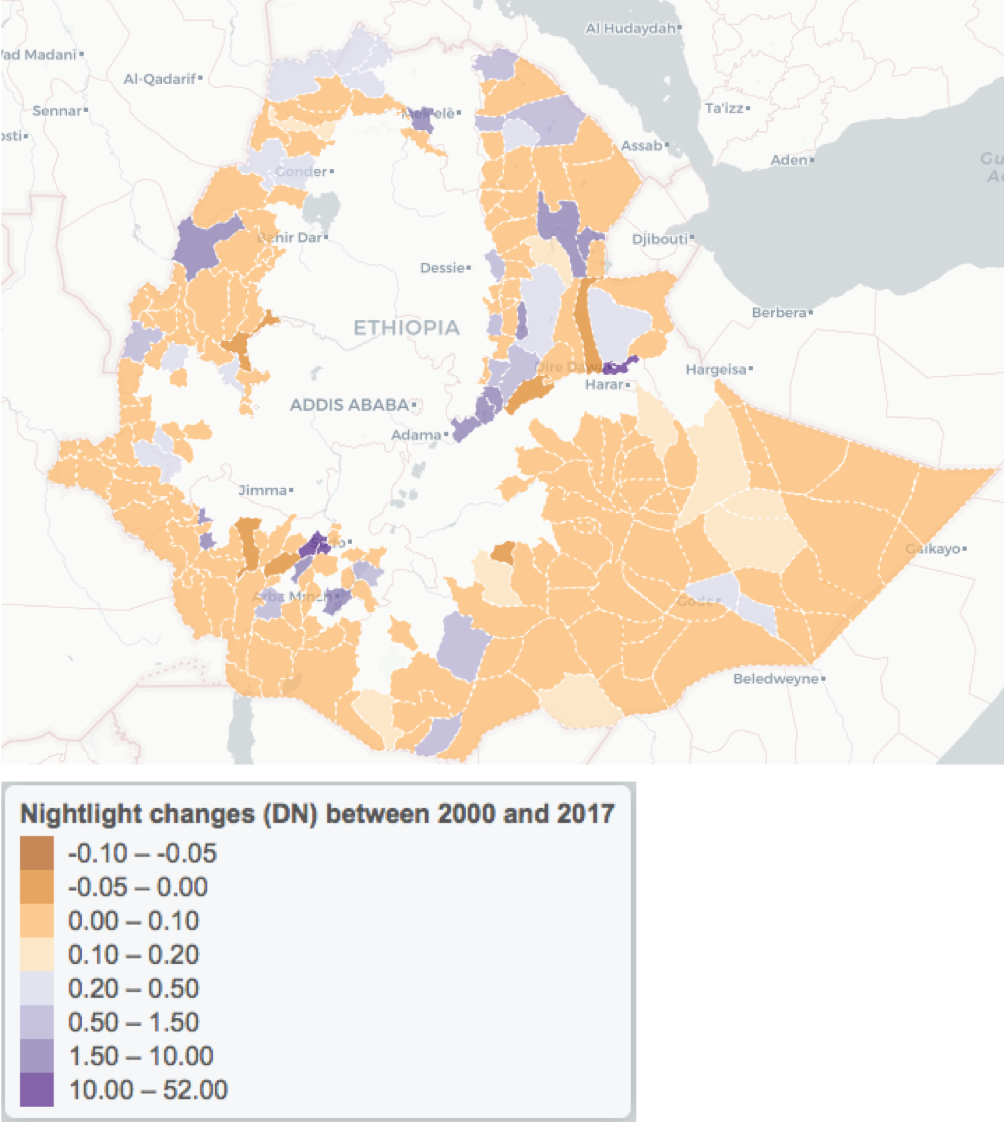
- Therefore, the nightlight change between VIIRS and DMSP for lowland Ethiopia between 2000 and 2017 reflect more of the industrial and economic activity but less residential activity.
- Dubti and Aysaita in Afar region, and woredas Dire Dawa and Dire Dawa Town in experiencing a lot of nightlight changes. It can indicate these areas are having more economic activities compare to other woredas.
- Afar, Dire Dawa, and SNNPR are the most active regions by looking at nightlight change for the past 17 years;
A full analysis of nightlight trends and its interactive maps can be viewed in this online notebook.