Results
Population dynamics
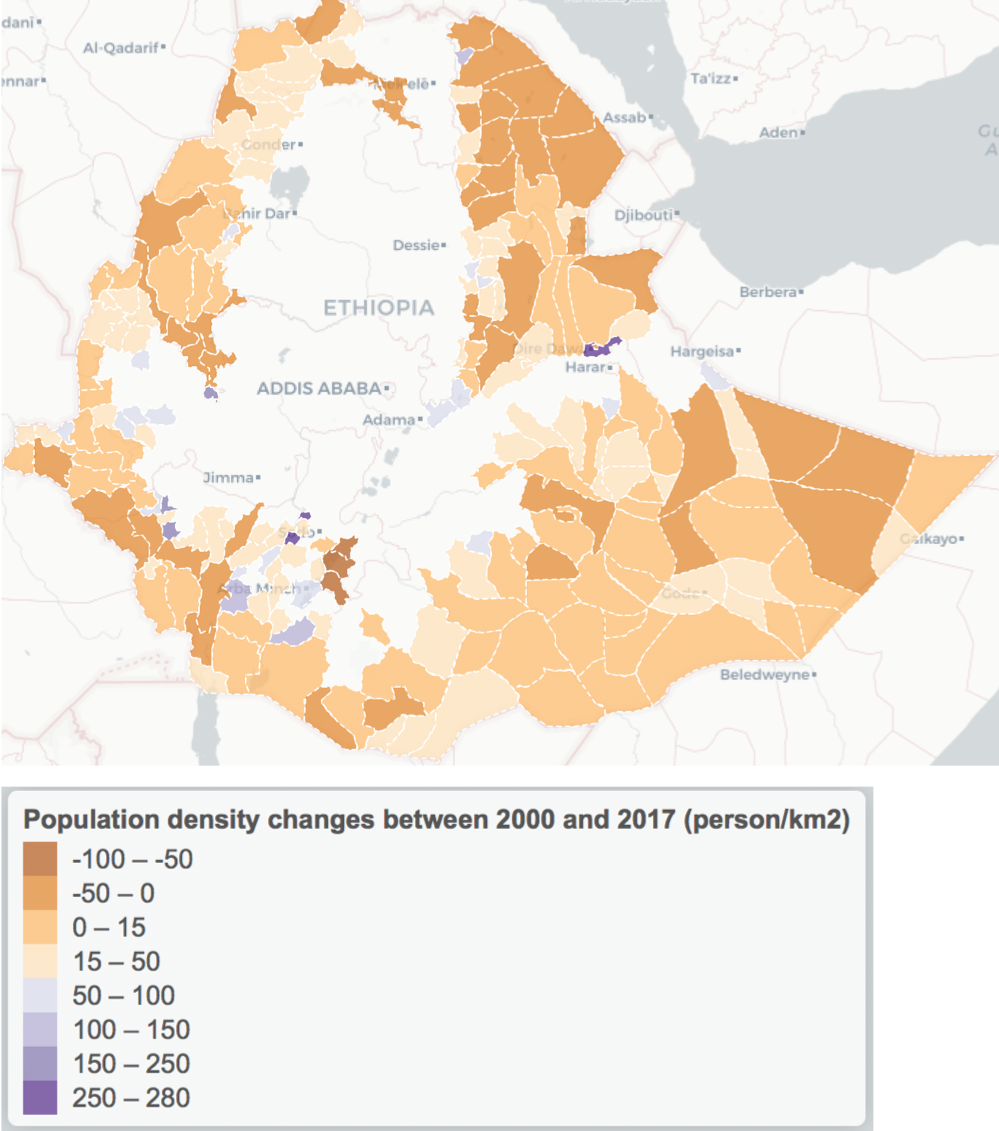
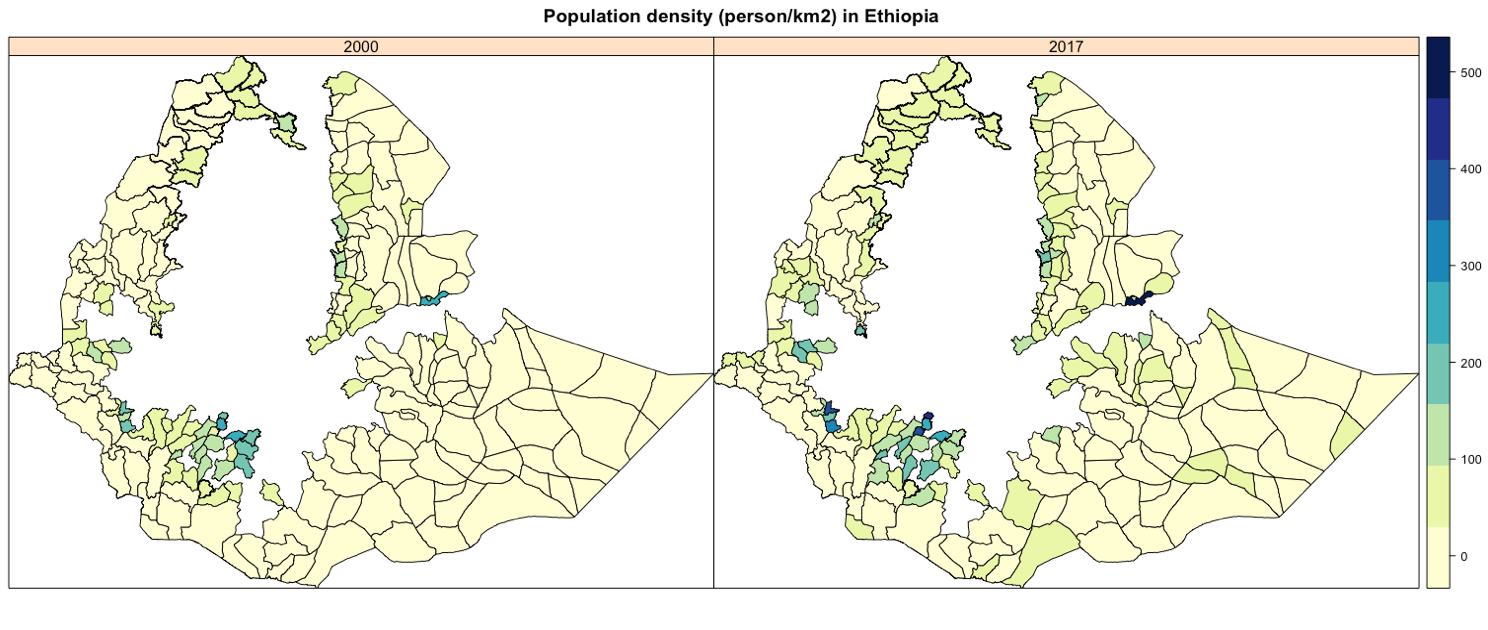
Population density increased in the majority of lowland woredas from 2000 to 2017. We found that population density increased by more than 150 people/km2 in 6 woredas - Chwaka (Oromia region), Yeki (SNNPR region), Dire Dawa (Dire Dawa region), Boloso Bombe (SNNPR), Kindo Dida (SNNPR), and Debub Bench (SNNPR).
Population density decreased in 49 woredas, including 15 woredas in Afar region, 3 in Amhara region, 6 in Beneshangul Gumu region, 1 in Dire Dawa region, 2 in Gambela, 5 in Oromia, 6 in SNNPR, 7 in Somali and 3 in Tigary. A full analysis of population dynamics and its interactive maps can be viewed in this online notebook.
More detailed findings are:
- We found more than a quarter million people move to Dire Dawa region in past 17 years;
- A lot of woredas in SNNPR are having more than 100,000 population growth in the past 17 years;
- Afar region is experiencing population growth too, e.g. woredas Boset, Fentale. But 15 woredas of Afar have negative population growth especially in northern Afar region.
In general, the trends in population density shown here align with our predictions of changes in a built-up area between 2000 and 2017. Population density and the built-up area increased in the southeast of the country where Oromia and SNNPR regions, as well as in the southwest (Afar region) and in central Ethiopia near Addis Ababa.
For more information, please see the online interactive graph and source code here.