Results
Athi River EPZ
Athi River is a town of approximately 113,000 inhabitants (according to a 2009 survey) situated just south of Nairobi, Kenya in Machakos County. It is situated at the intersection of two major transport routes into the capital. Despite its size the town is one of the most industrialised in Kenya, with a focus on cement and steel production. The Athi River SEZ is site of the head office for the country's Export Processing Zone Authority (EPZ), which was established in 1990, by the EPZ Act CAP 517, Laws of Kenya. The Authority's mandate is to promote and facilitate export oriented investments and to develop an enabling environment for such investment, guided by the Ministry of Industrialization and Enterprise Development.
The SEZ was intended to attract multinational companies, and offer Kenya greater global economic reach. This is where its economic impact/success would be expected to be broadly measured. However, for the local economy the aim of the Athi River EPZ was job creation. The EPZ has also recently attracted substantial additional recent investment thanks to a reported Sh20b injection from Chinese firms to establish a further incubation park to support African companies in technology, manufacturing and production and provide value-added services to help them export their products to global markets.
- Size analyzed: 300 hectares
- Established: 1993
- Phase: Operational
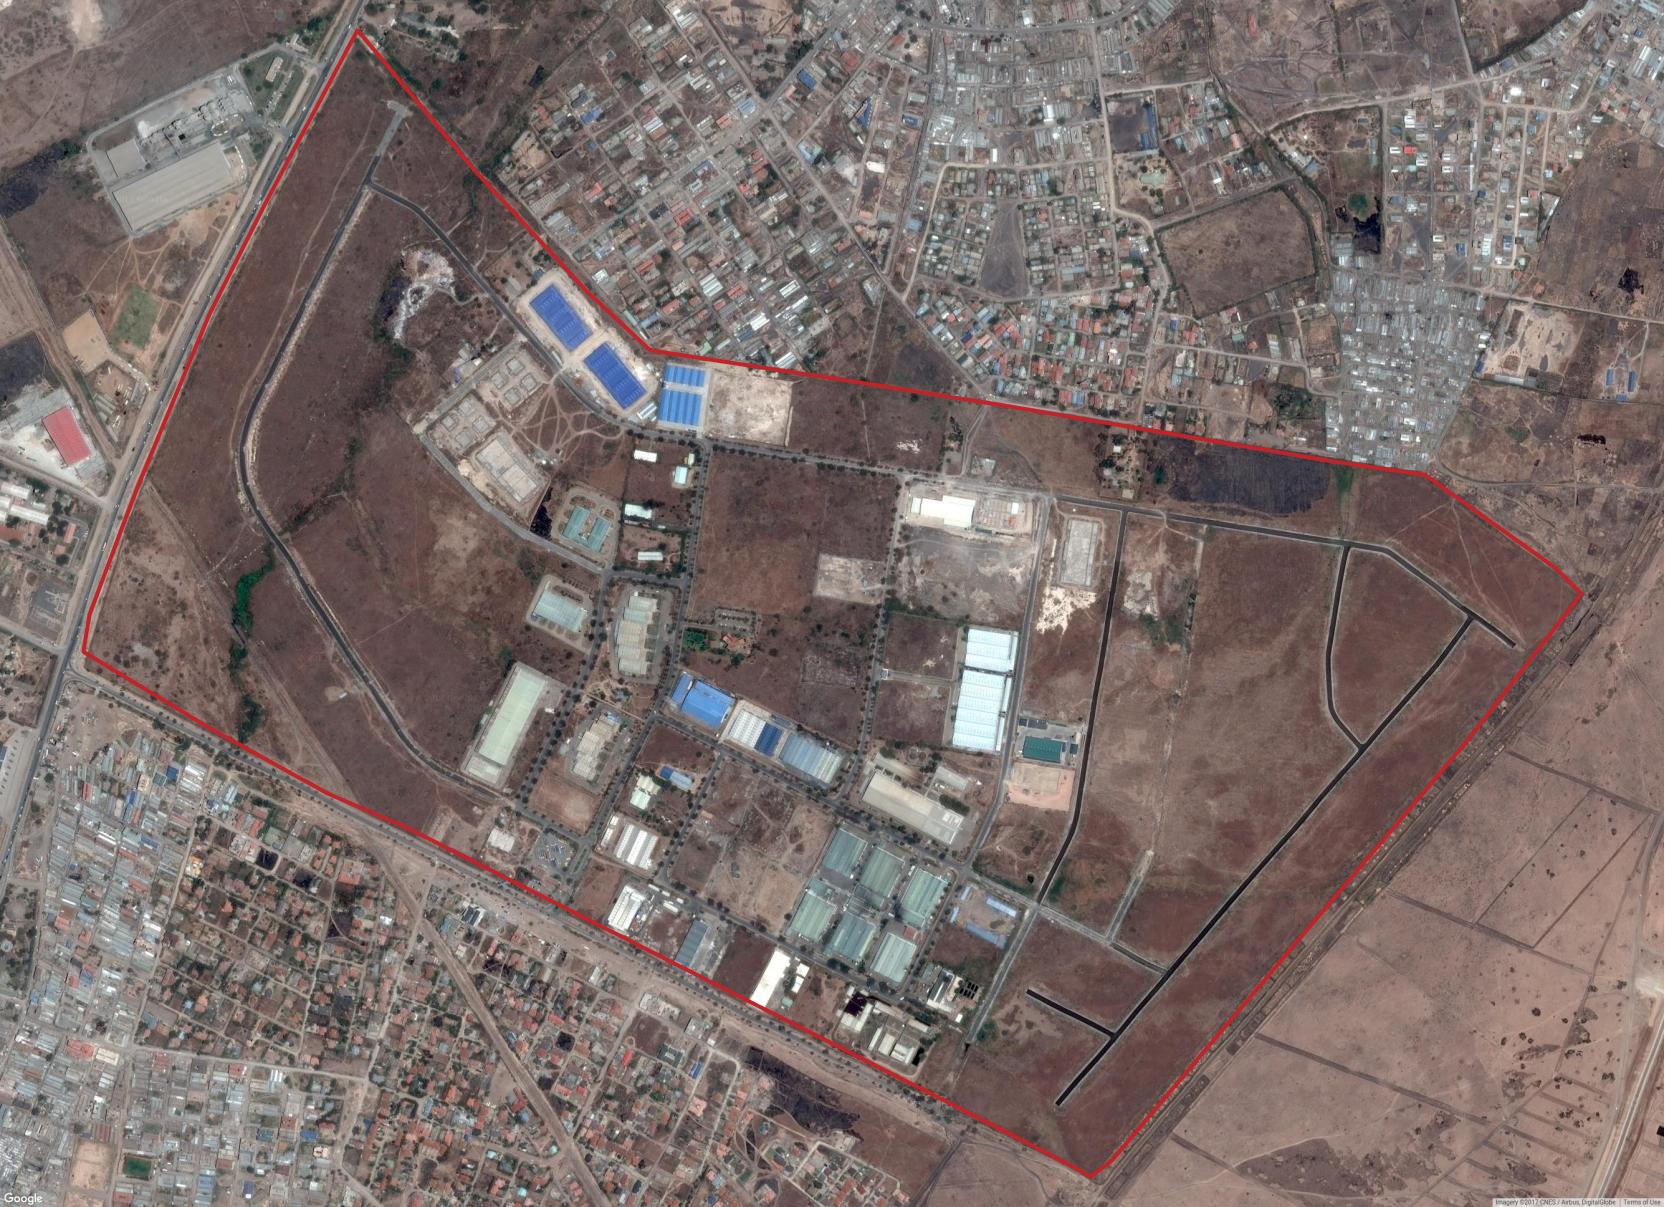
Several of the indicators use Digital Globe’s high resolution imagery. For this zone two Worldview-02 images were used, 5 years apart: 2012-01-01, and 2017-01-24. Both these dates fall within the operational phase of this zone.
Analysis
A long established site, with excellent infrasturctural connections, created with a mandate to drive export industries and extend reach along with local job creation. Due to the age of this site, longitudinal assessment of this site is only possible via EO imagery analysis - assessable CDR data will not be available. Nonetheless, automated assessment of land use changes, industrial building footprint, electricity consumption and automated counting of vehicles from imagery will, when set against knowledge of those firms established in the EPZ, can provide insight into export activity and potential impact on balance of trade.
In addition, recent CDR data (if available) would provide subjective indicators at to whether the current state-of-affairs in the SEZ supports the notion of expanding international reach. This is possible through assessment of international communication activity (assessing international connectivity of the zone and its reach) - but also through an assessment of freight movement, which may also be derivable from CDR.
New approaches to assessing the impact local economy of particular potential in this region. Analysis of anonymized CDR profiles in this Kenyam site would not only provide high-confidence estimates of employment levels on the actual site itself, but allows us to understand which residential areas of the city are benefitting from that employment.
Furthermore, and unique in many ways to East Africa, there exists the additional potential of analysing mobile money flows (approximately 25% of Kenya’s GDP flows through mobile money such as m-pesa).. Such analysis provides micro-indicator assessment of both wage growth and income levels, and hence a lens into those established economic macro-indicators
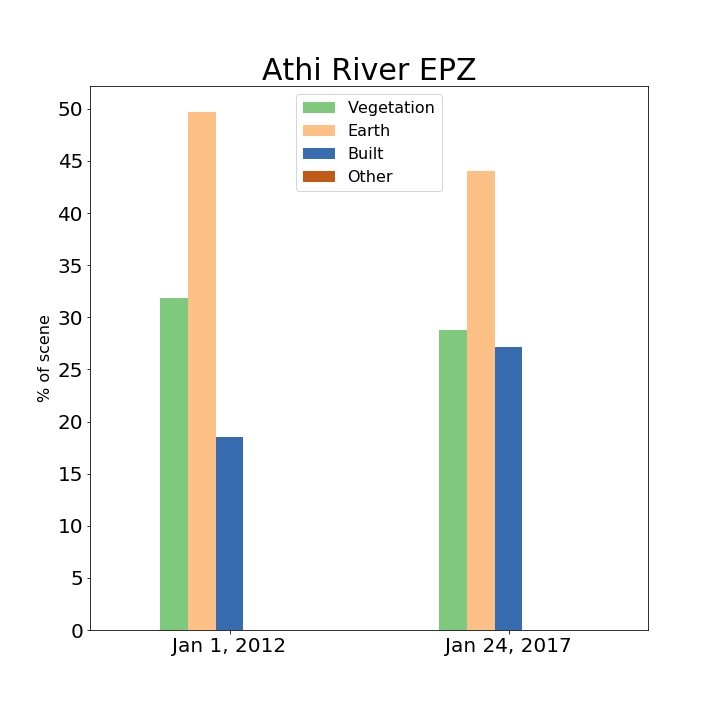
Land Classification
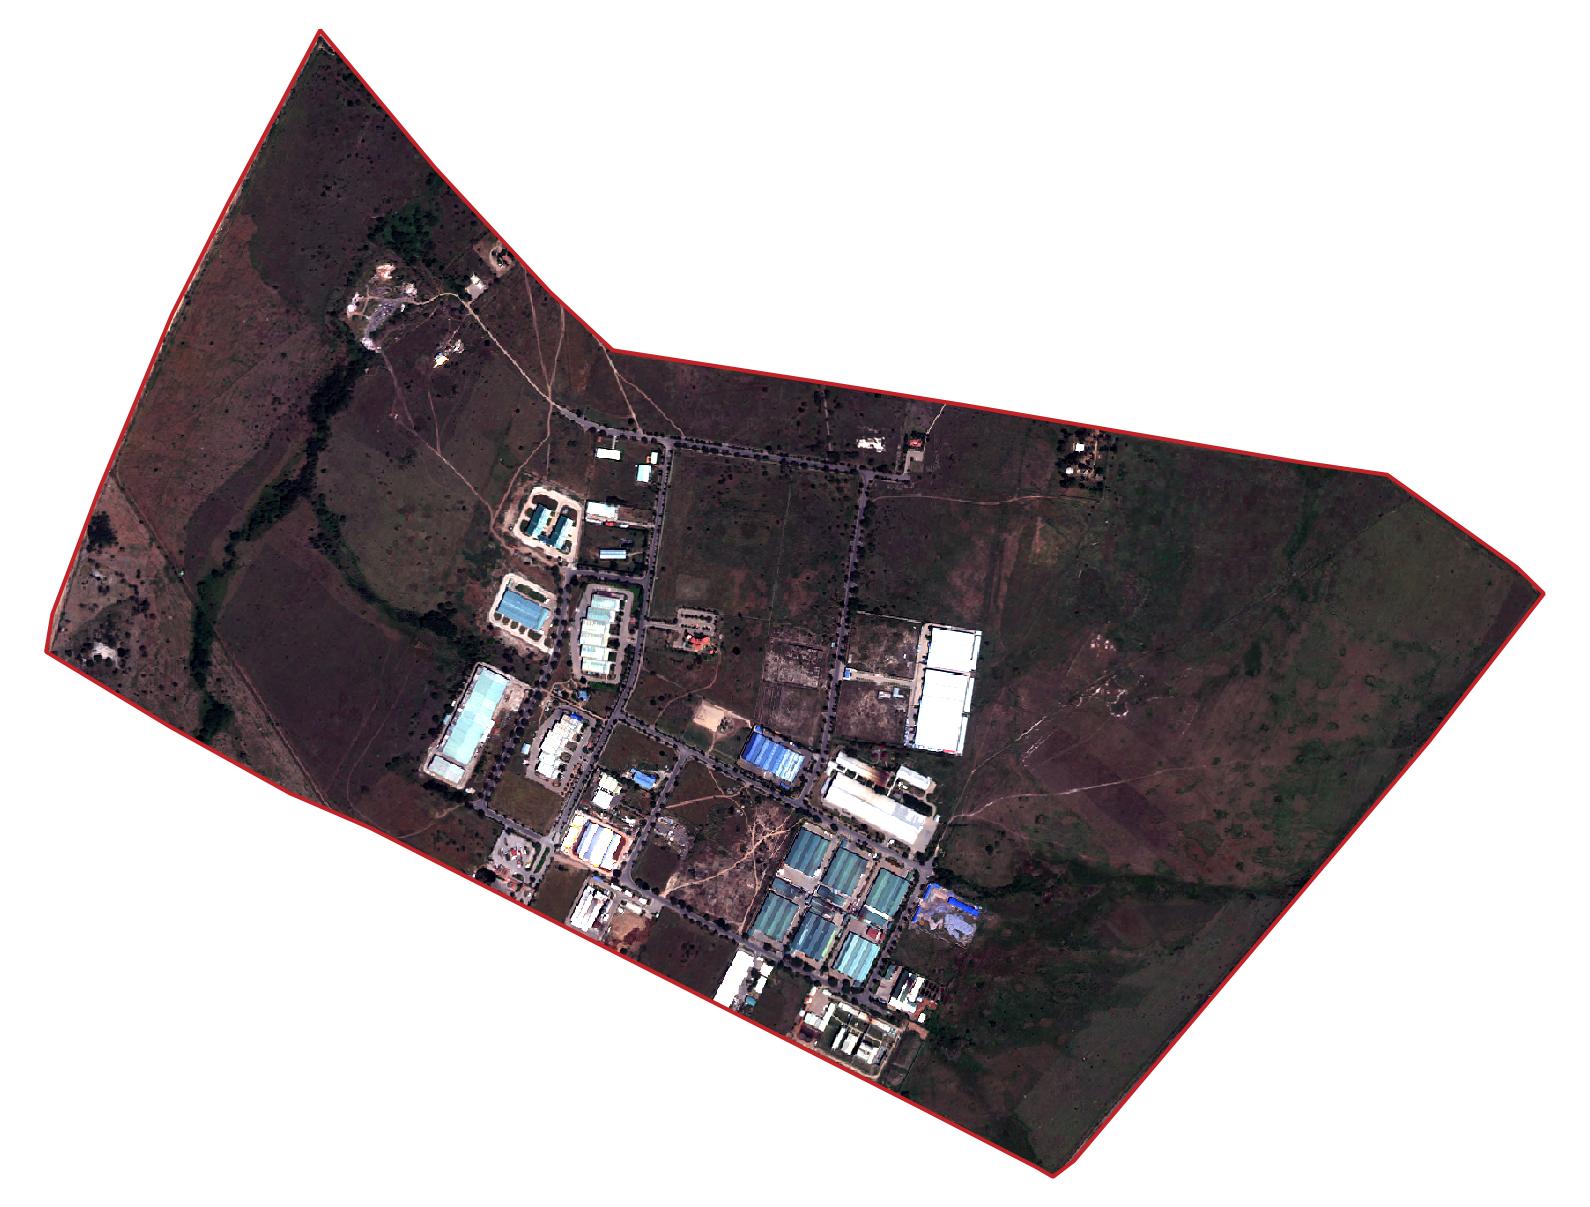
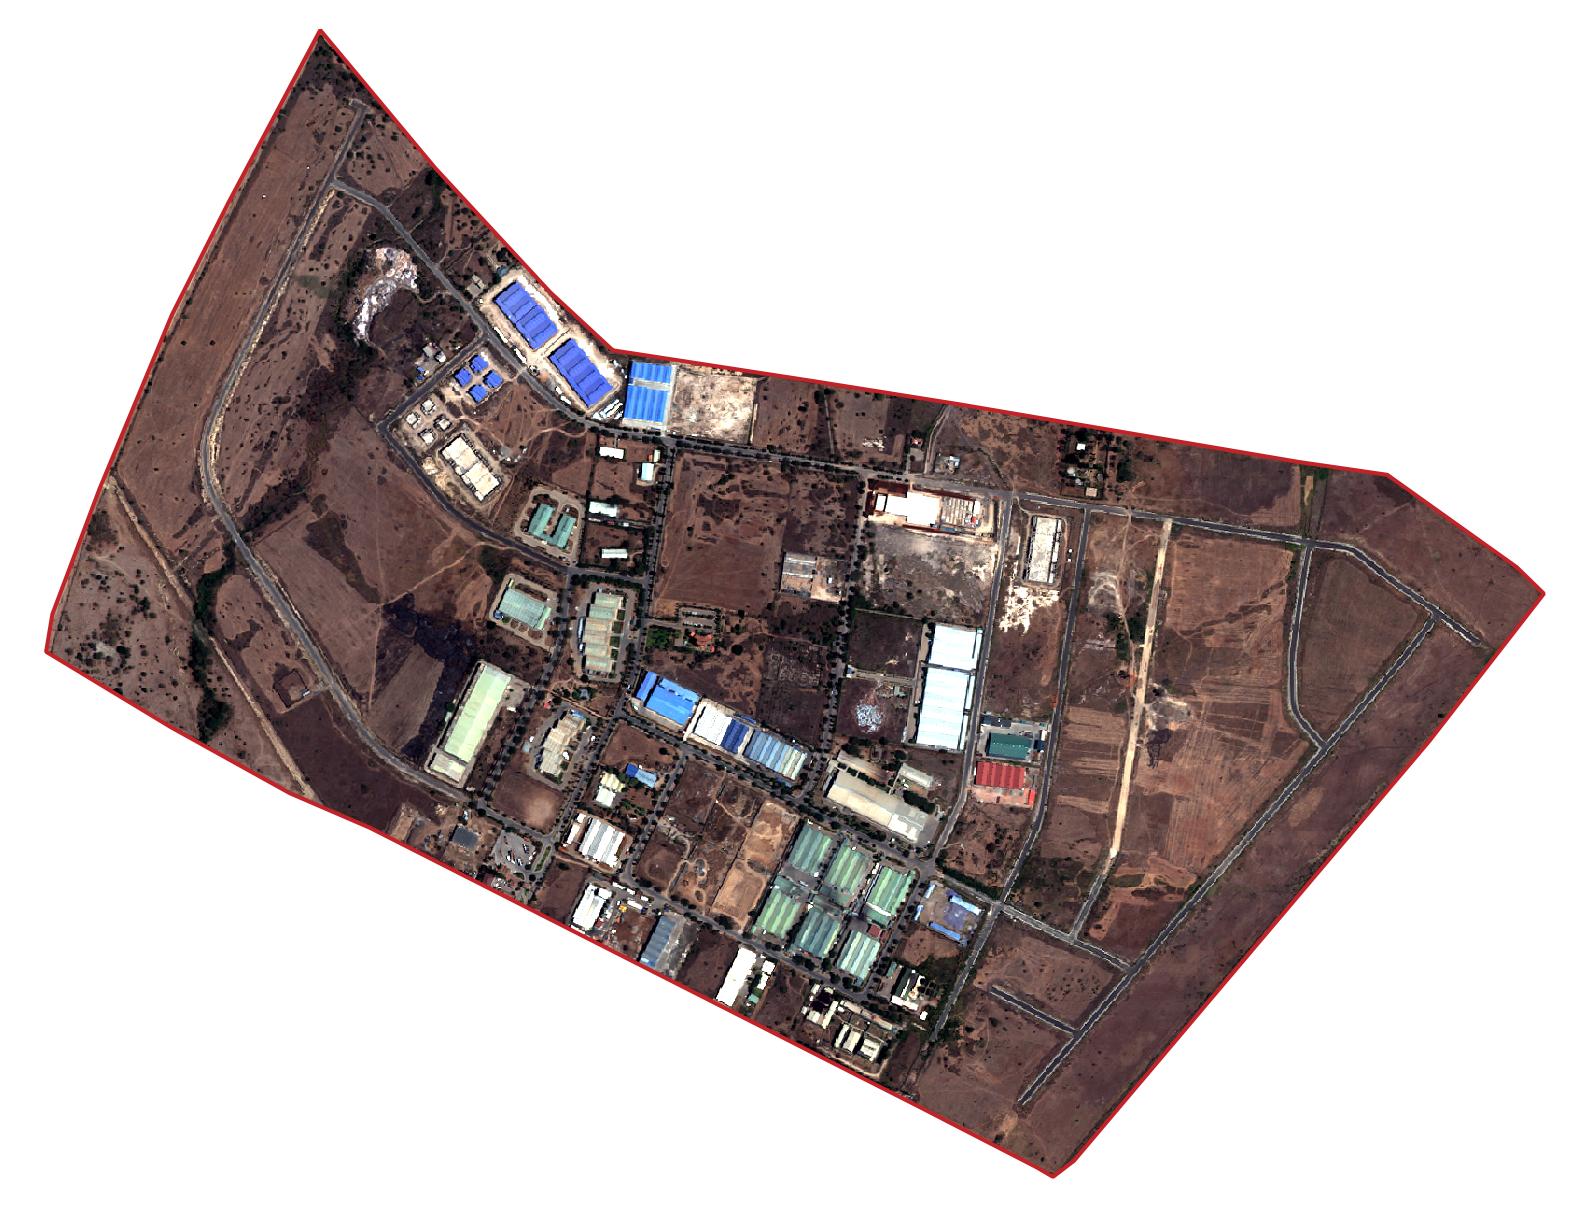
Land classification was performed with the two Worldview-02 images, which show both new roads and buildings over the 5 year period. Several misclassified clusters can be seen between the two.
- a spotty patch of built area (blue) appears on the left side of the first image, but should be vegetation (green)
- several roads (blue) in the first image are classified as earth (tan) in the second image
- the lower buildings are classified as vegetation (green) in the second image
The class confusion may be able to be improved by increasing the number of clusters, allowing further differentiation of spectral signatures, but more classes can also make labeling more difficult.
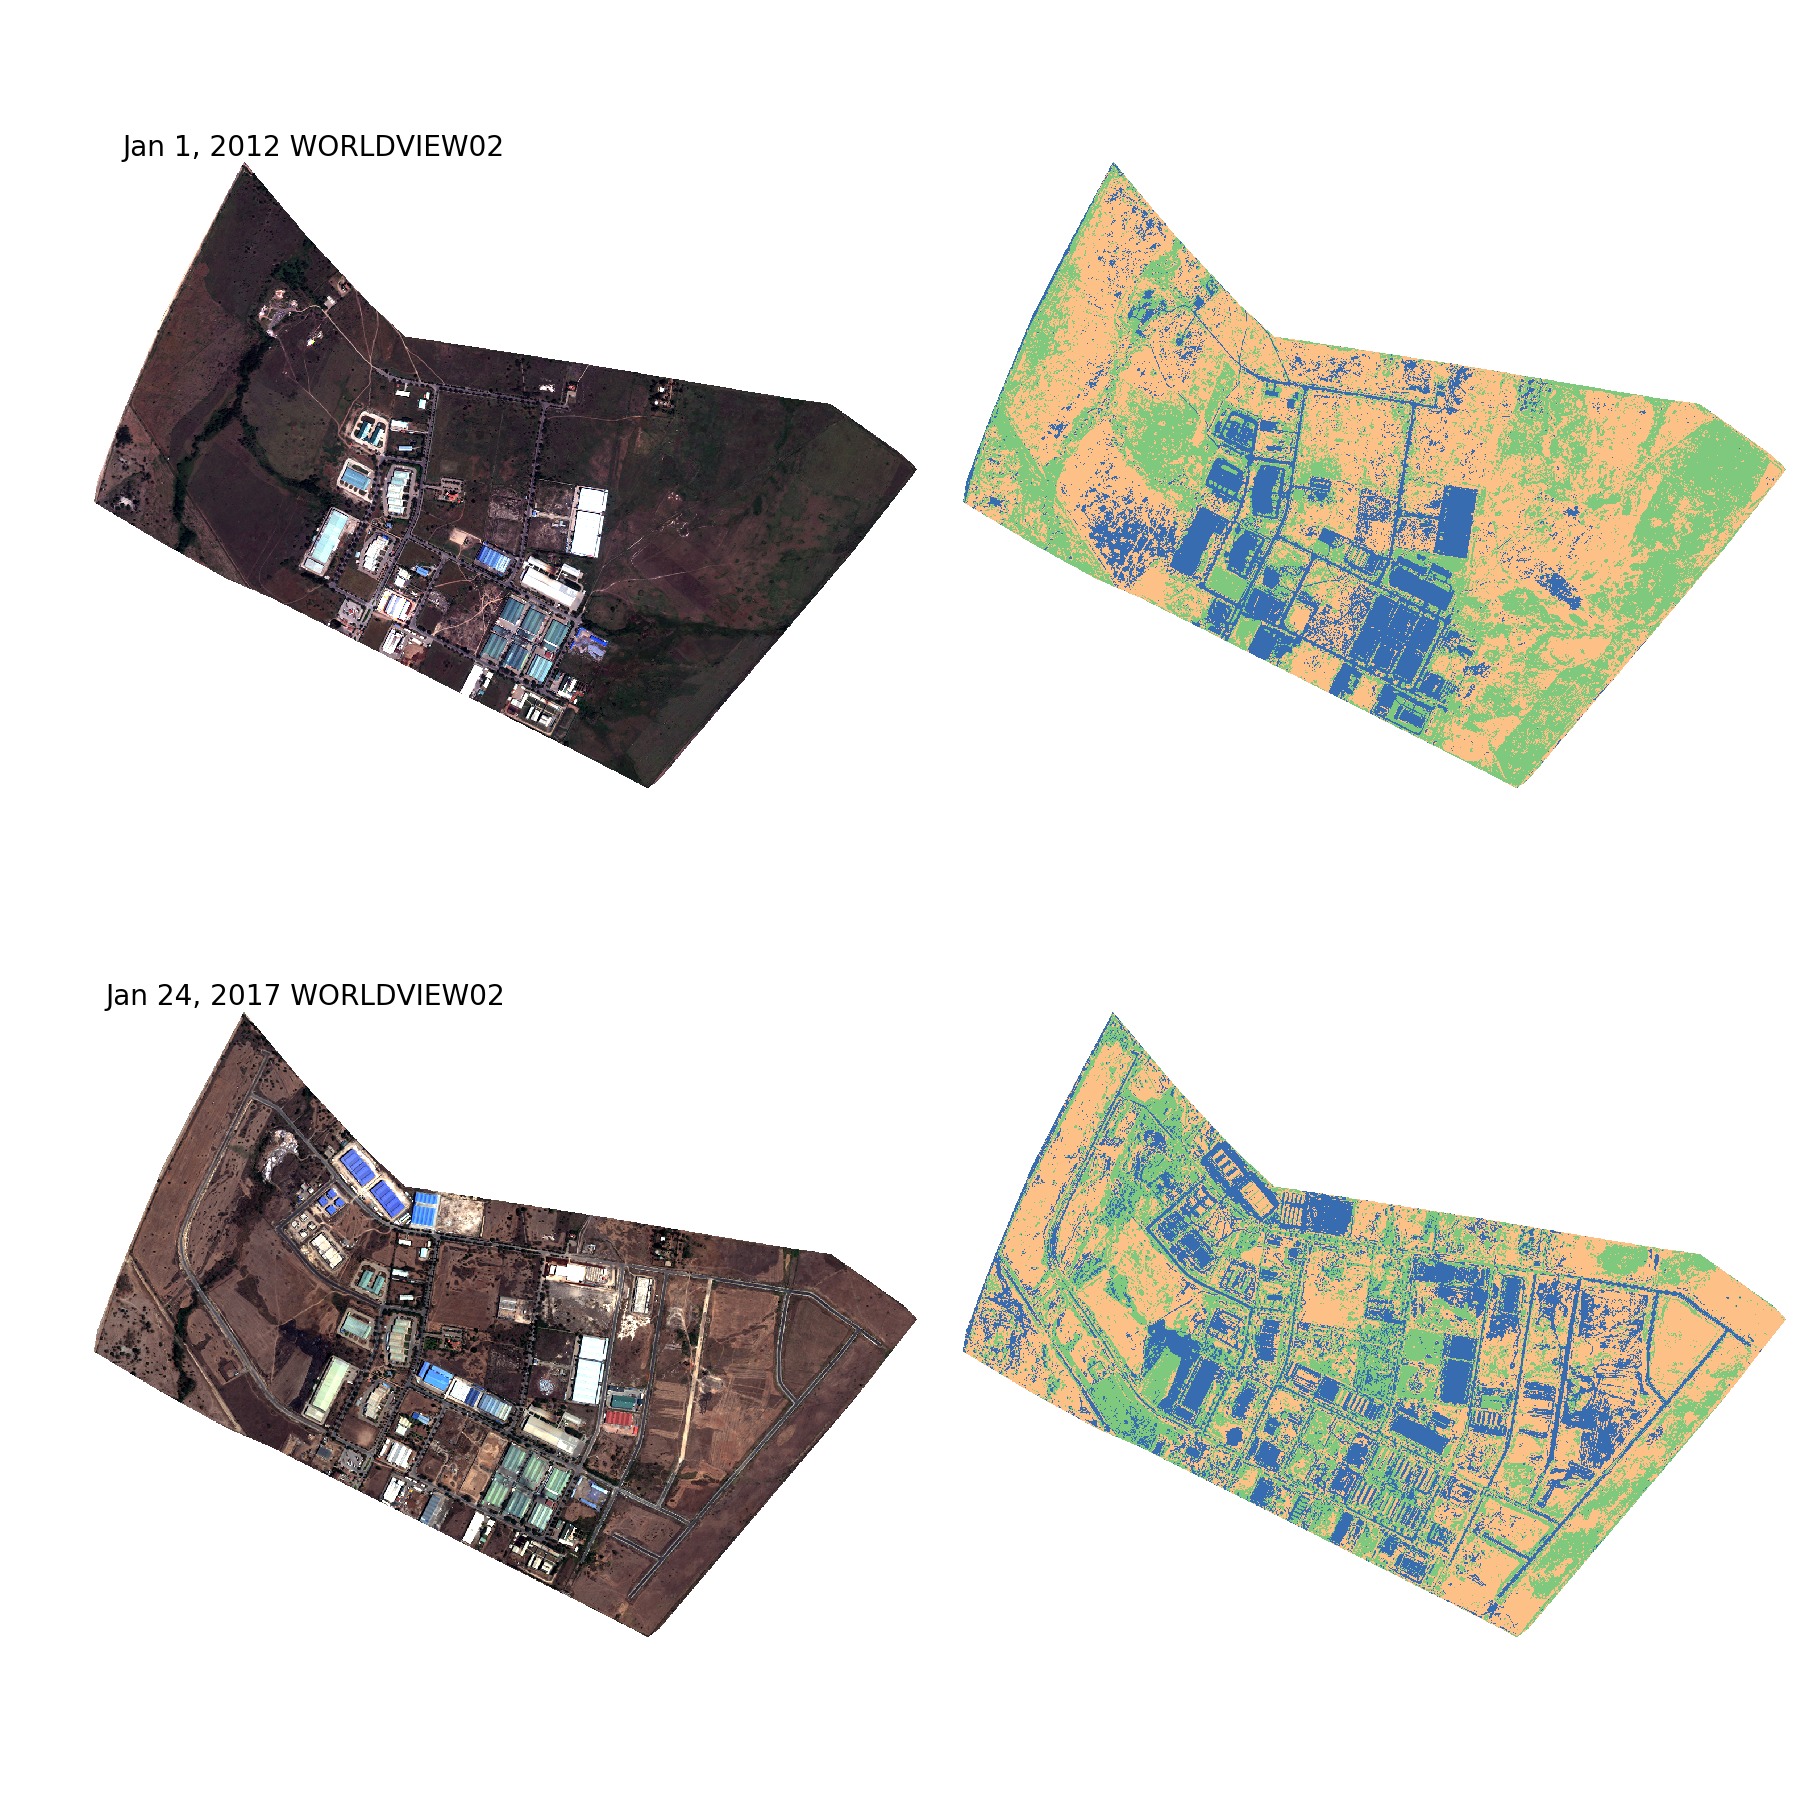
However, overall the clustering performs well. Earth and vegetation areas have shifted over the 5 years, but most of the additions of built area have been identified. An 10% inrease is shown, but that is an underestimate given the misclassified regions above.
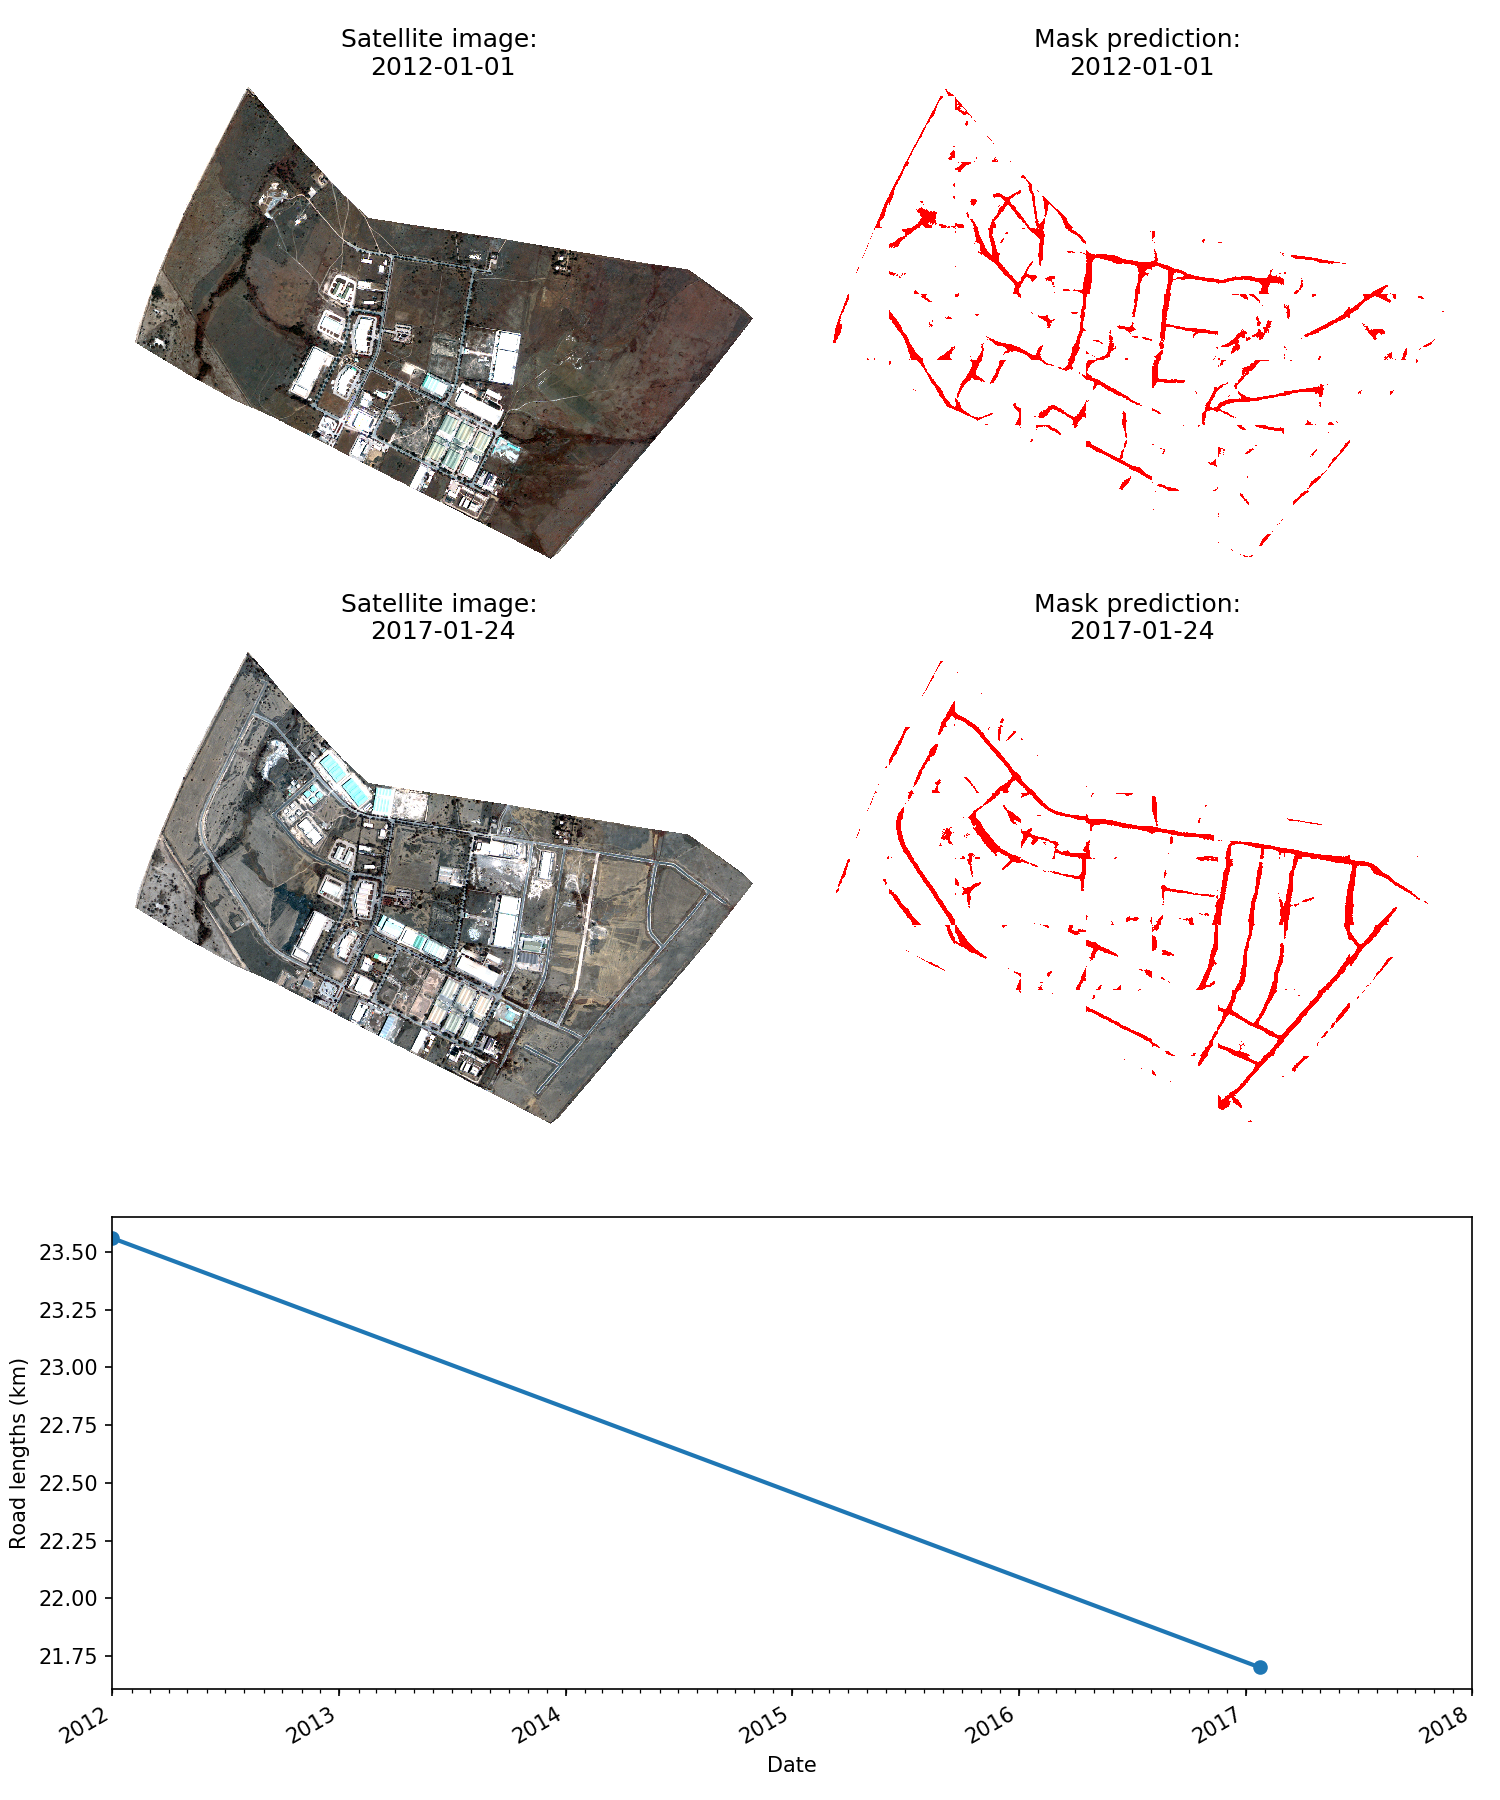
Transport Infrastructure
The total length of roadway (in km) was calculated using imagery from Digital Globe's Worldview-02 satellite. Here, Skynet gives a reasonable road mask though there is room for improvement.
Notice that total length of roadway goes down despite an increase in paved roads. Some of this seems to be attributed to the fact that small dirt roads and tracks are being removed as the zone develops (e.g., the upper left part of this zone). In the future, we may want to distinguish paved roadway from dirt roads and tracks.
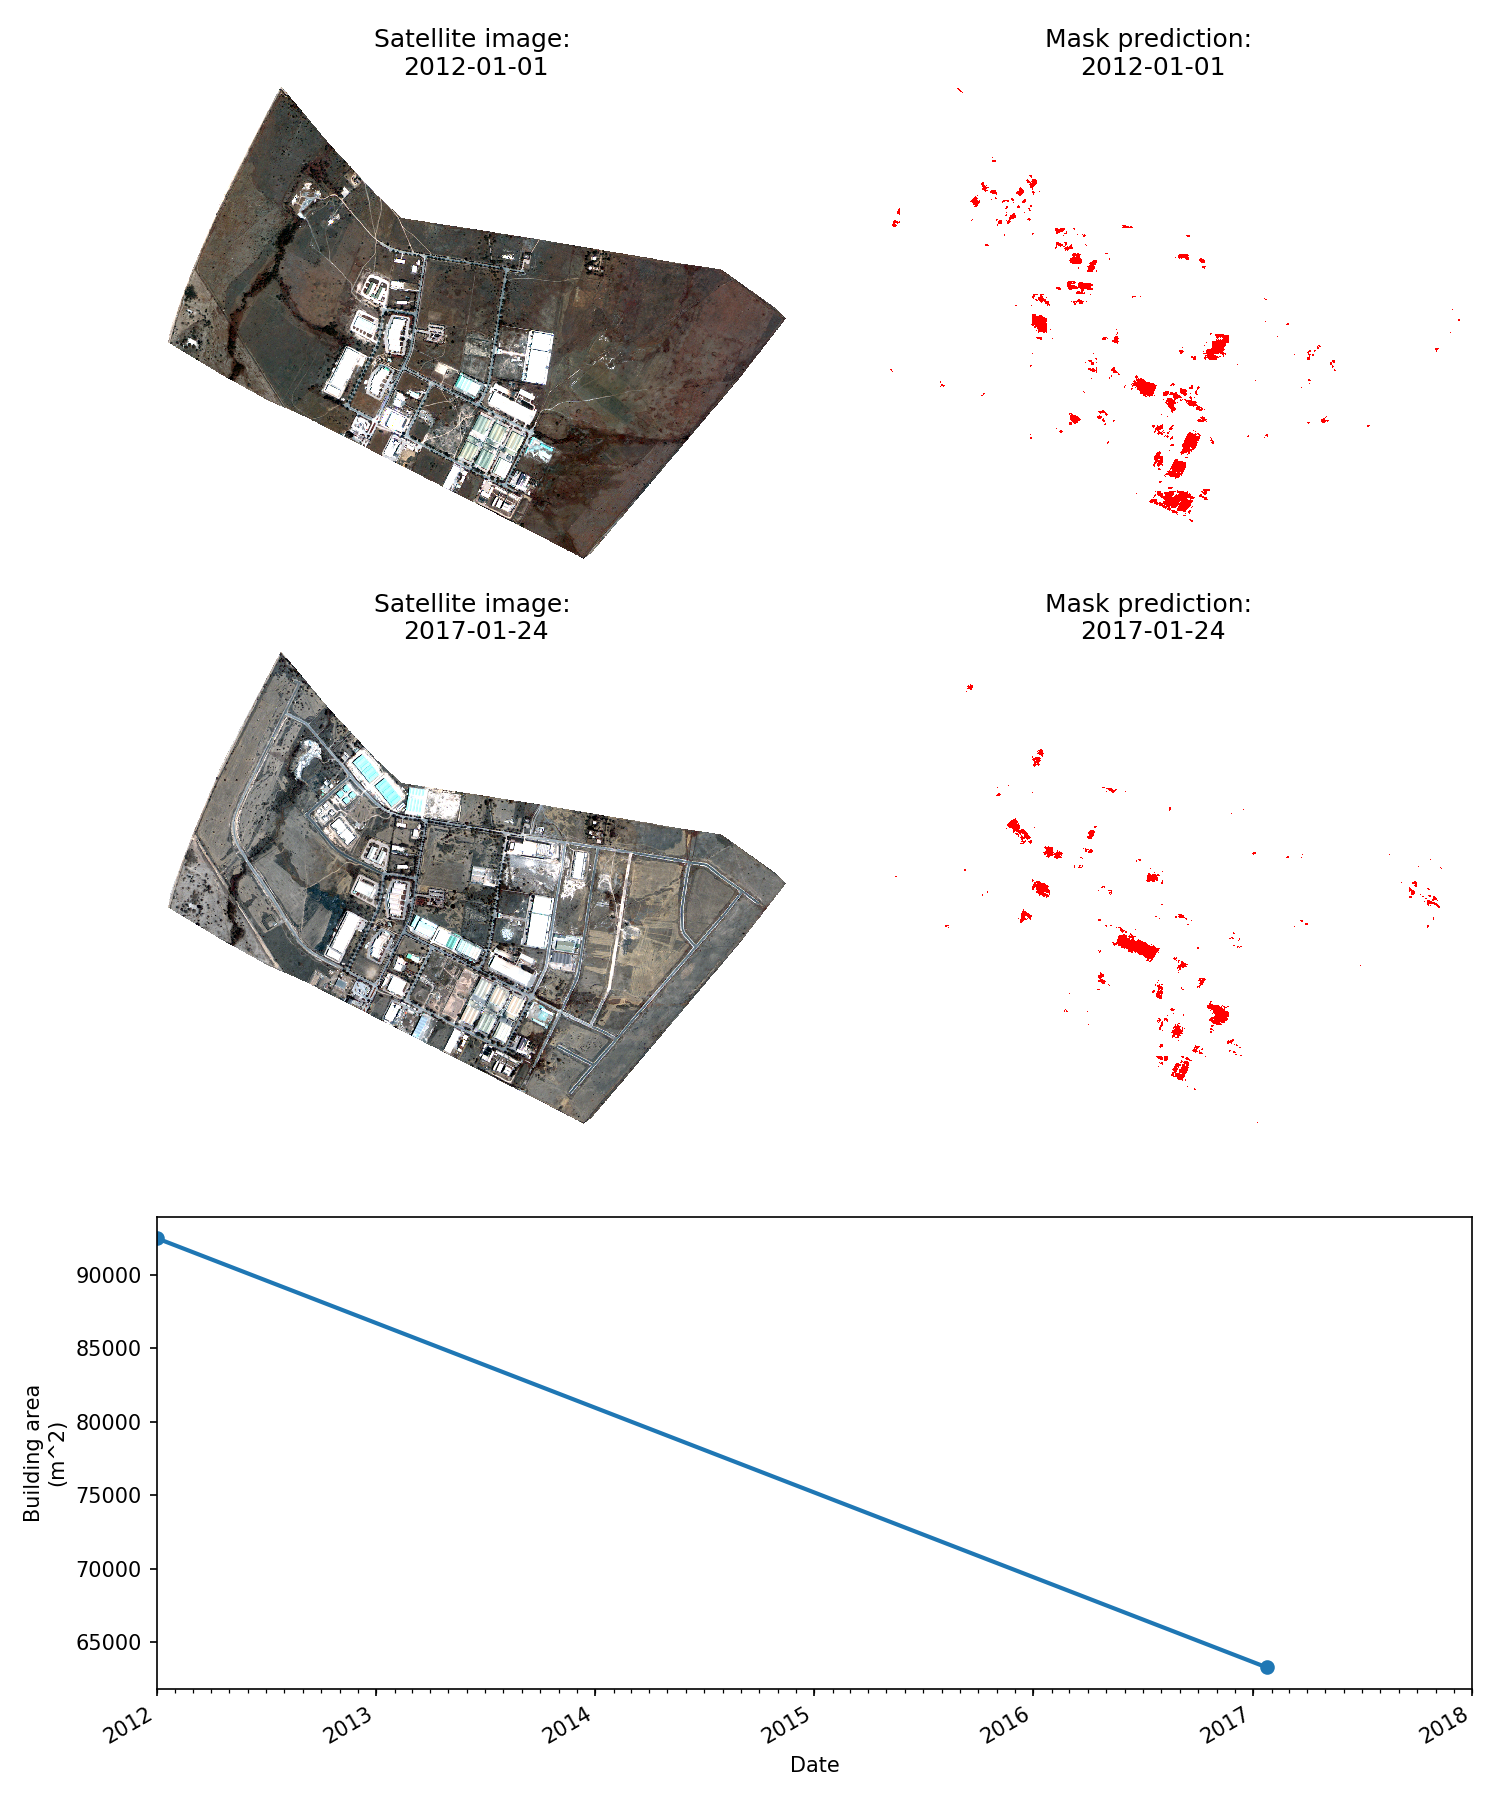
Building Footprints
The total building area (in m^2) was calculated using imagery from Digital Globe's Worldview-02 satellite. Here, Skynet does not do a great job segmenting buildings. This could be because it was trained using a larget trainig data set from a different area of the world.
Building Counts
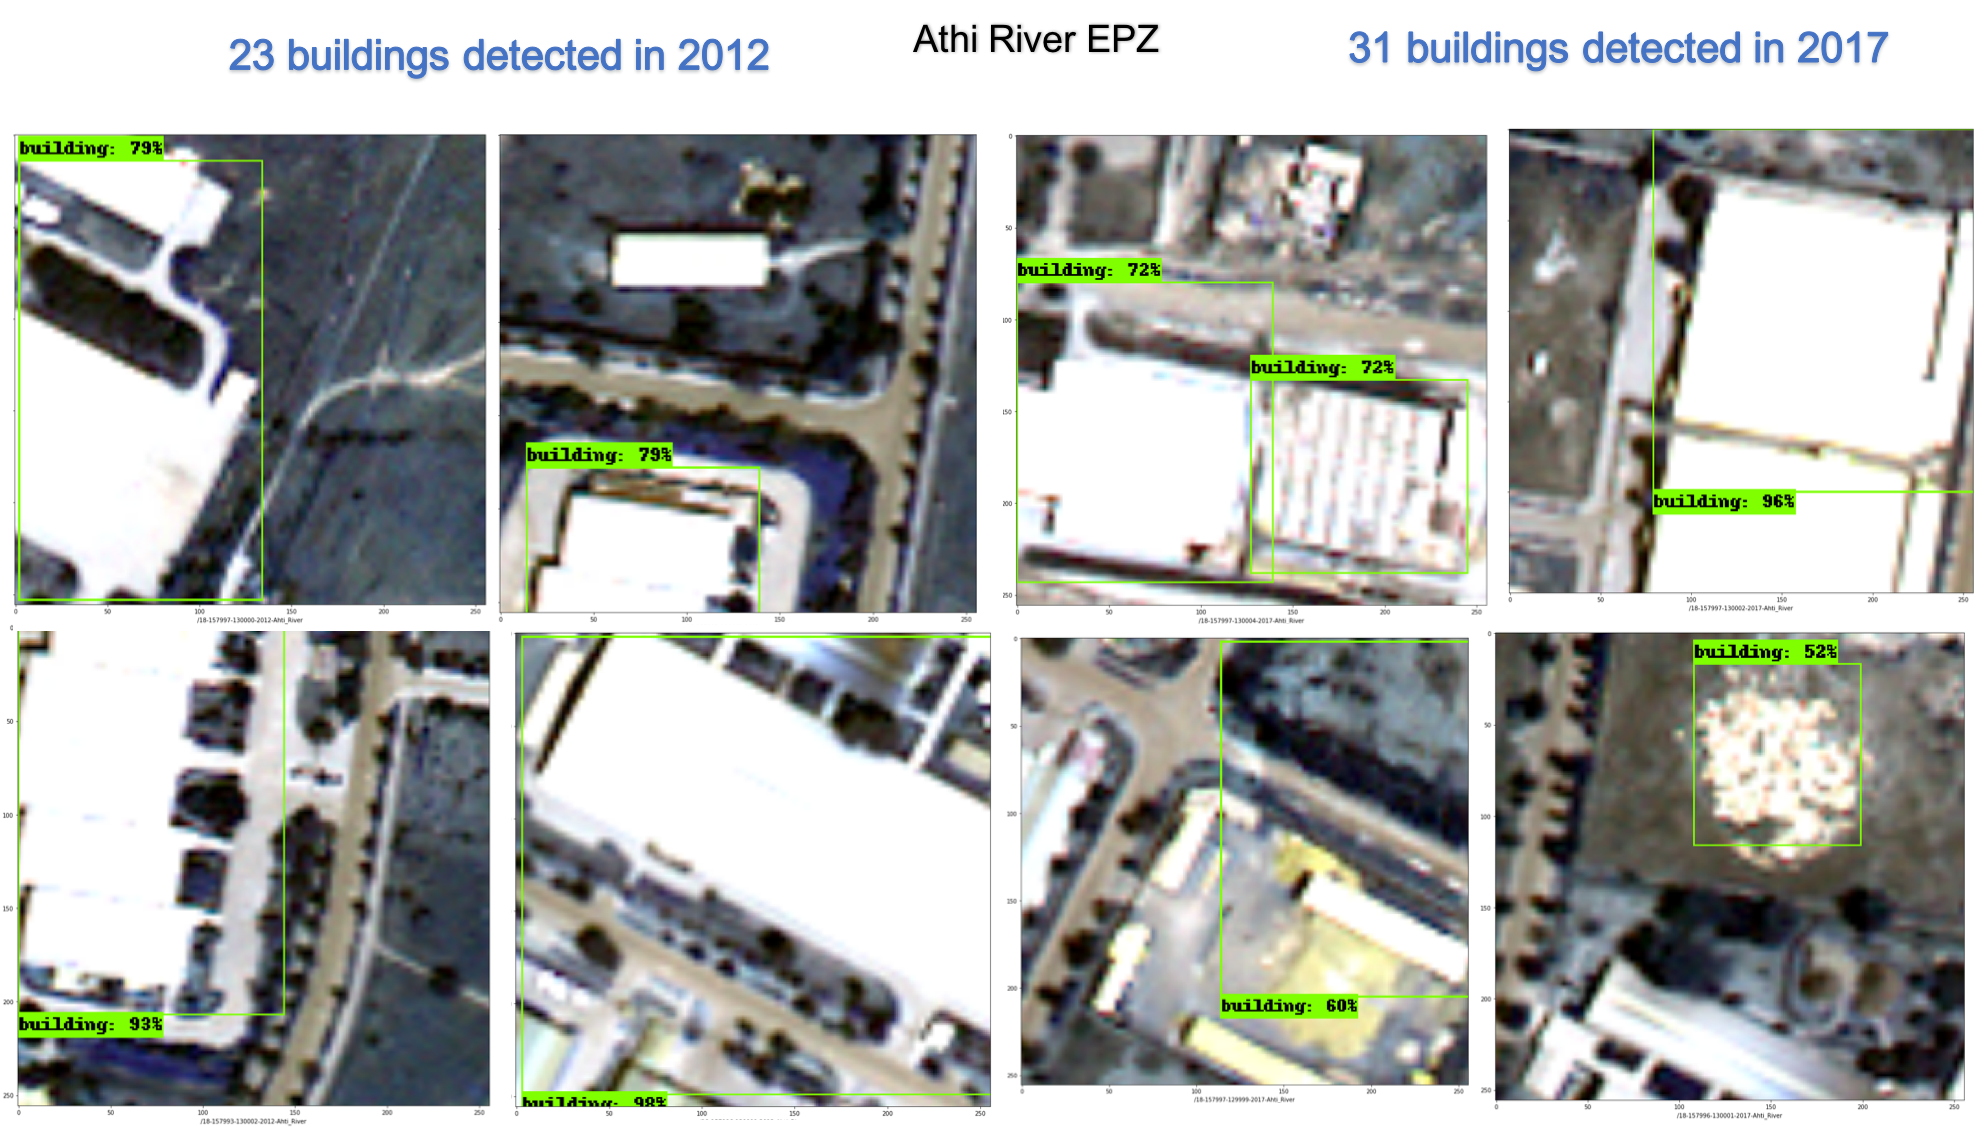
The building count indicator is built on top of Tensorflow Object Detection -- a convolutional neural network that attempts to find each building in an image. Each predicted building is outlined with a bounding box, so we simply count the number of predicted bounding boxes to get a building count. We trained this object detection model using Digital Globe vivid imagery and open street map.
Our trained Tensorflow object detection neural net was able to detect buildings pretty well, although it mistakenly recognized a road section as a building. We tested the neural net on Worldview in 2012 (January) imagery and detected 23 buildings.We found 31 buildings from Worldview image on Jan 2017.
Electricity Consumption
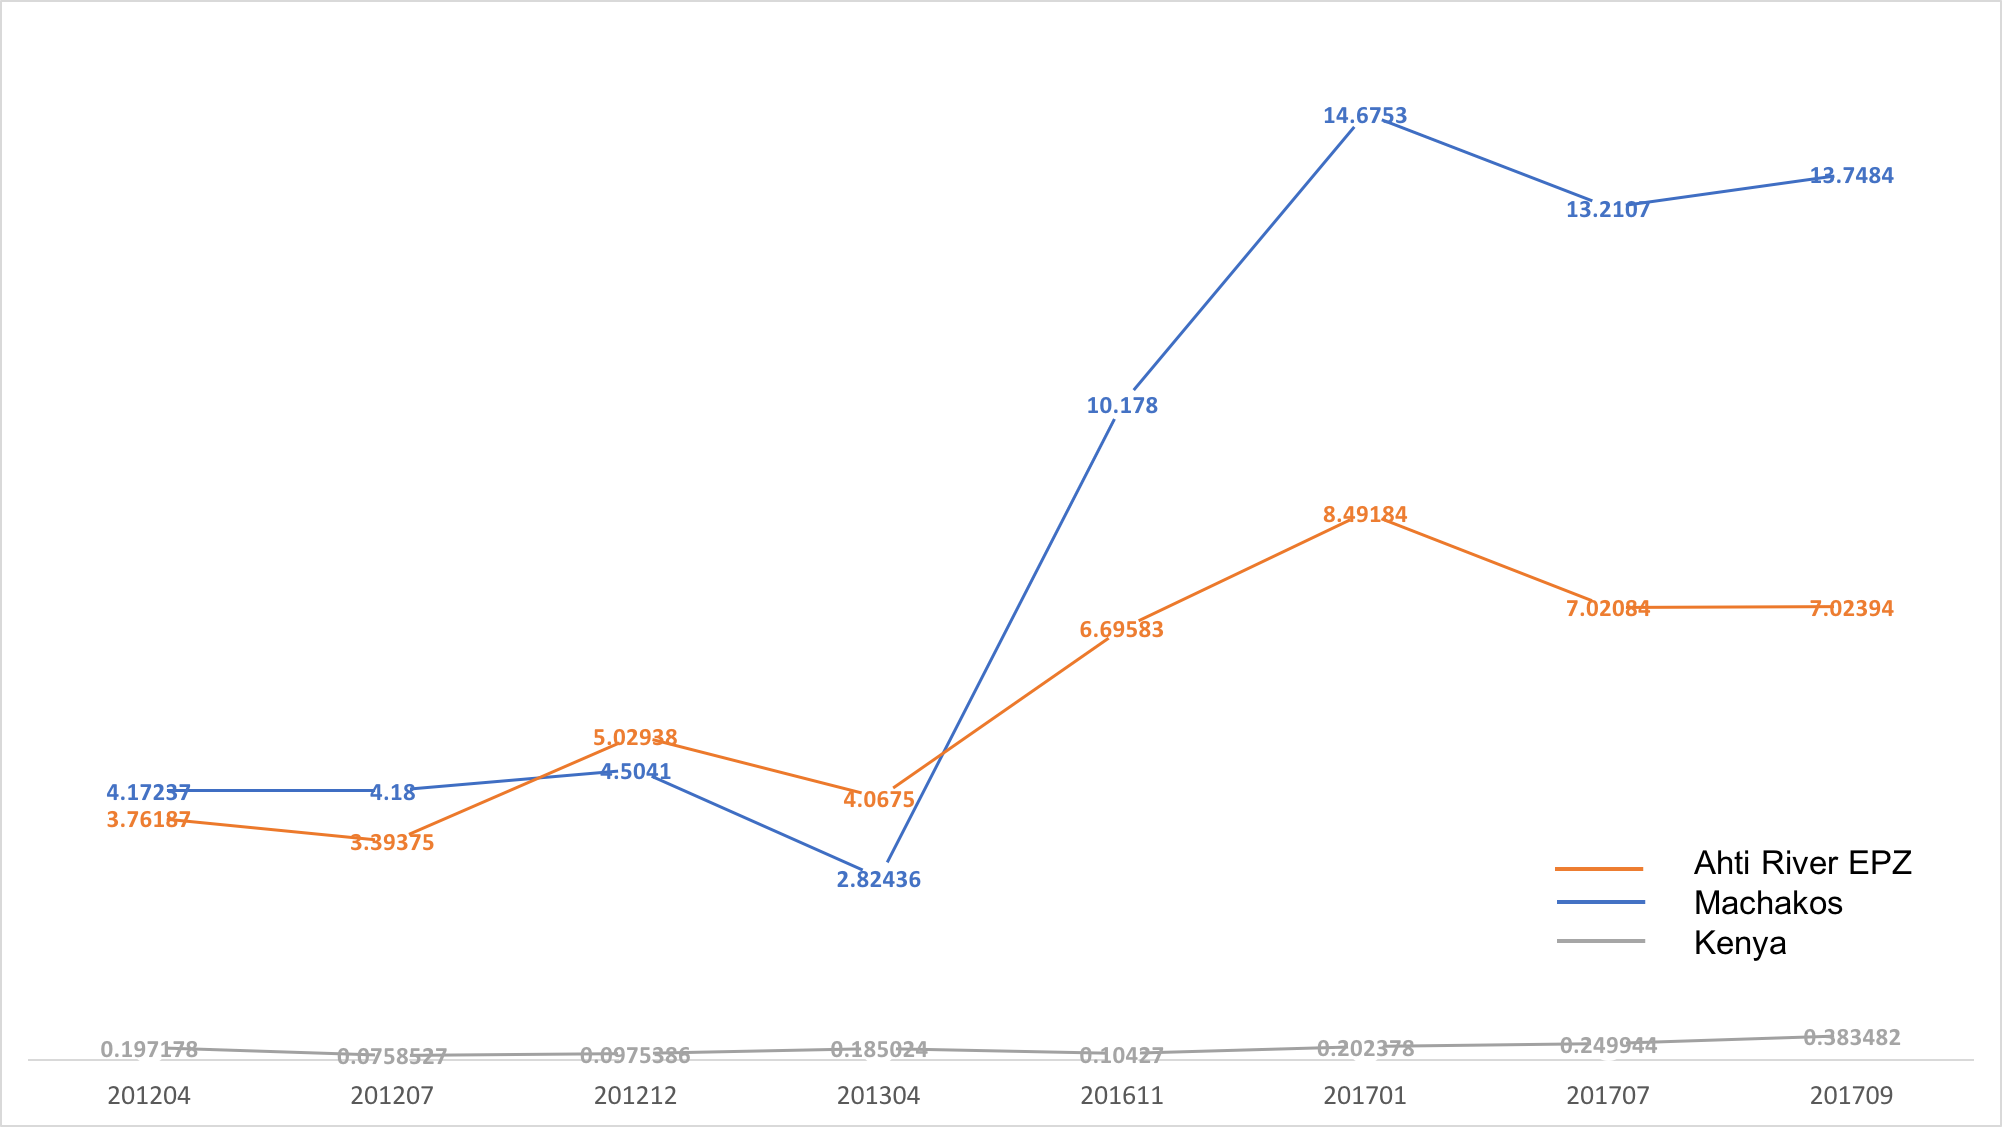
Electricity consumption is highly correlated to a region's economic activity. To estimate electricity consumption, we used the Visible Imaging Radiometer Suite (VIIRS) Day/Night Band (DNB) imagery to correlate nighttime light radiance. Specifically, monthly VIIRS DNB product from The Earth Observations Group (EOG) at NOAA/NGDC was used.
We put Athi River EPZ side by side with its nearby city Machakos, and found Athi River EPZ is using more electricity than the national level in Kenya. As a long-established SEZ sites, the mean electricity consumption of Athi River EPZ exceeded Machakos around 2012 to 2013, but overall it is lower than Machakos.
Electricity Reliability
As with electricity consumption, we used the VIIRS DNB imagery to estimate electricity reliability. We can estimate electricity reliability by computing radiance at night for each zone. By looking for times when a region's lights are dark, we can estimate the number of outages for each month. Working with daily VIIRS imagery is difficult though, as it is not preprocessed by NOAA/NGDC. Therefore, stray light, lighting, lunar illumination, and cloud cover all act as confounds.
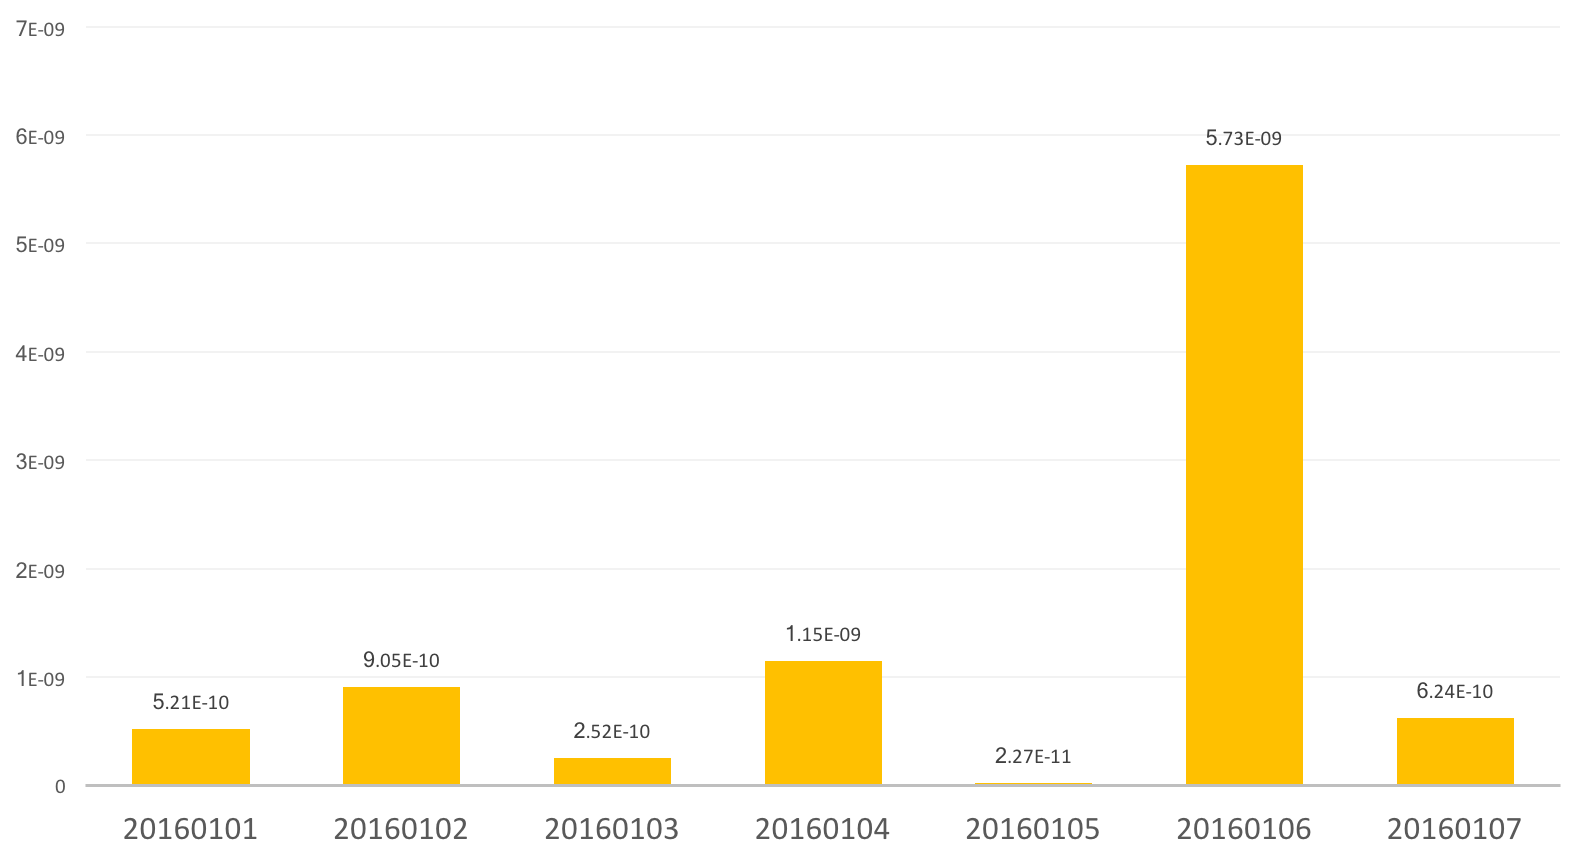
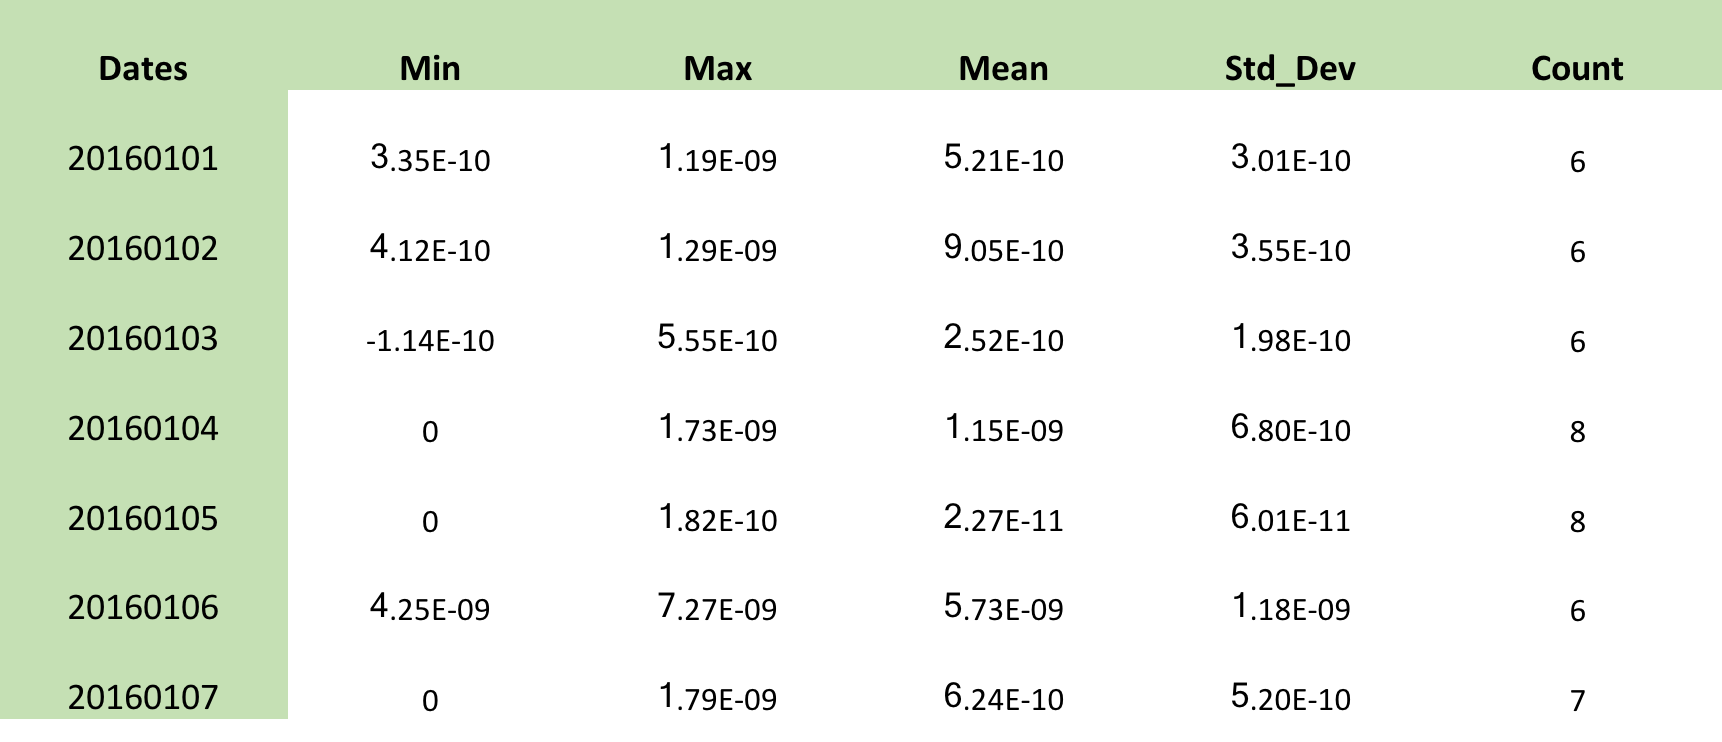
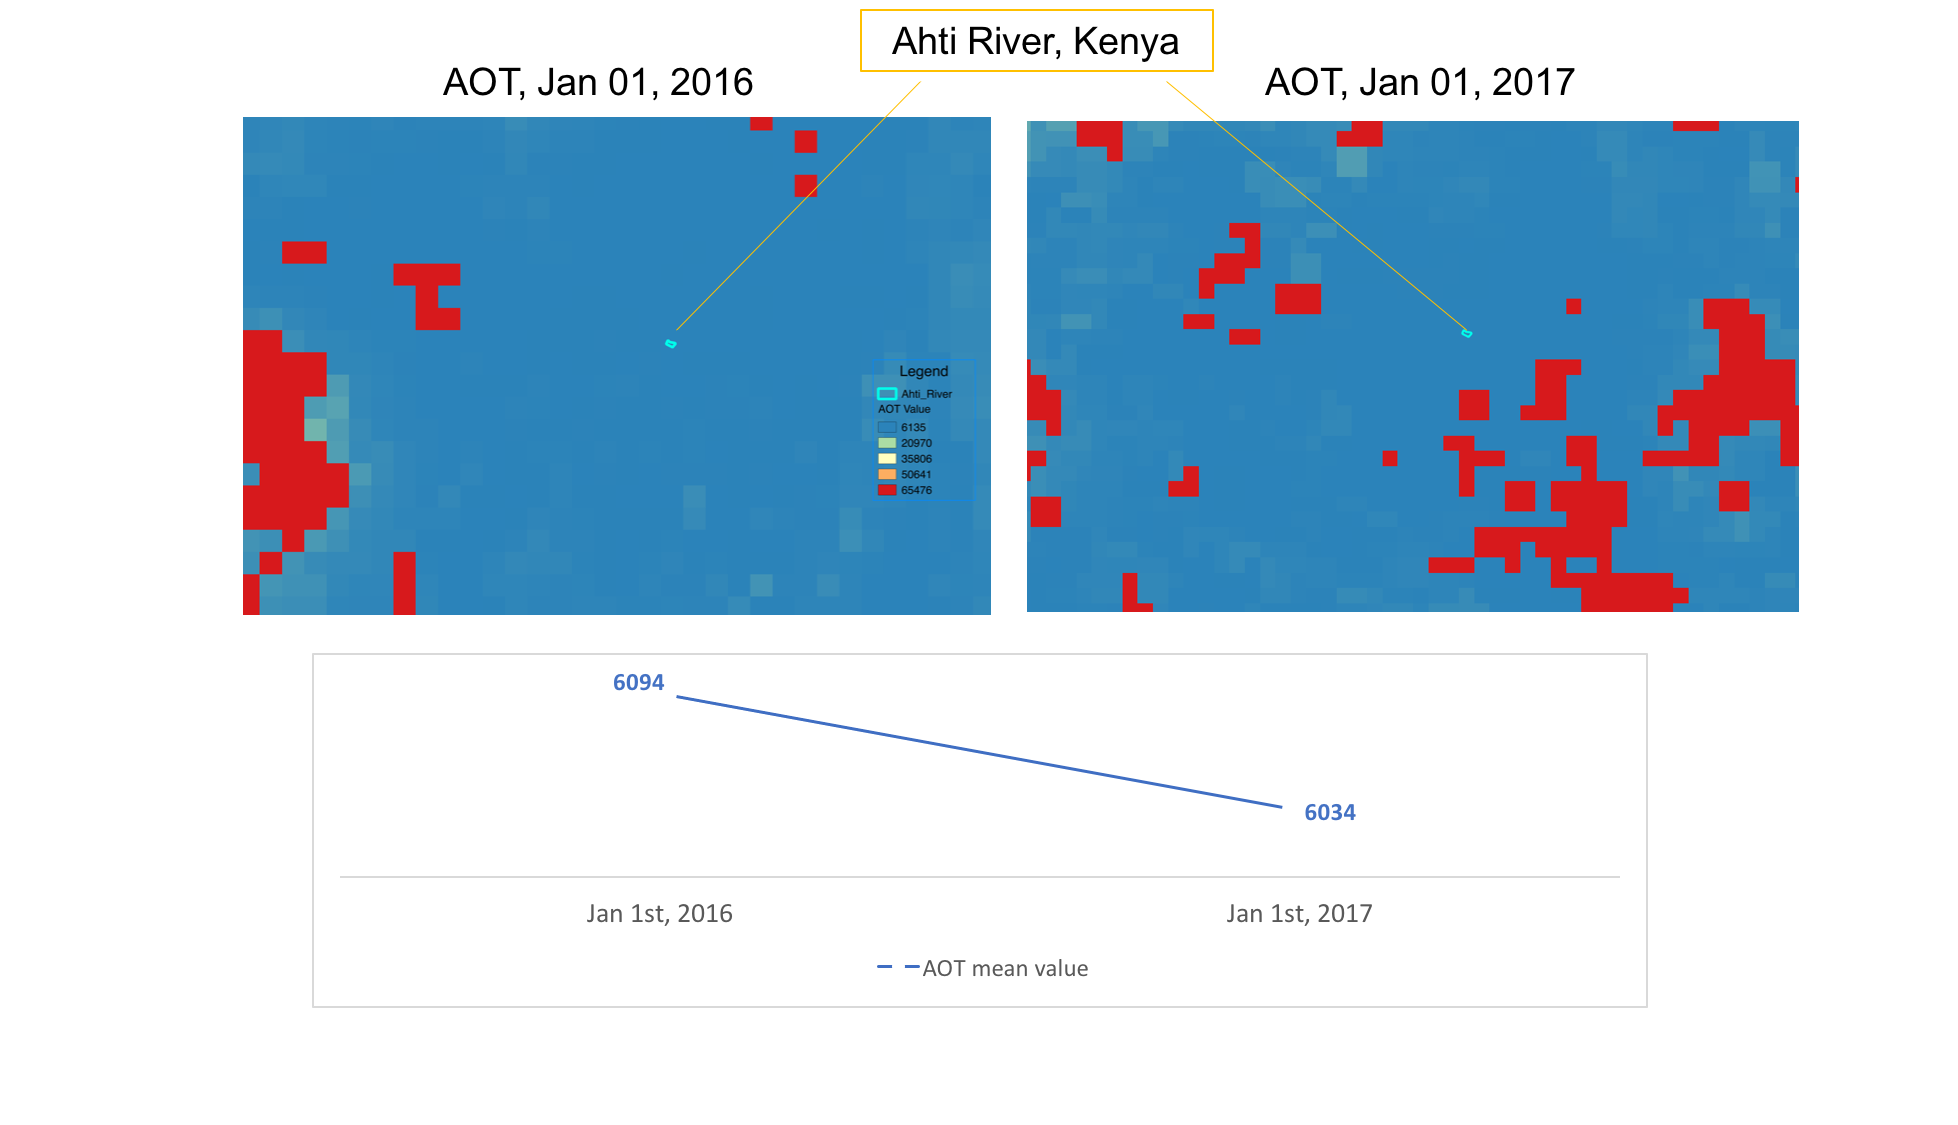
Air Pollution
Air quality and air pollution can also be monitored through VIIRS satellite imagery. Aerosol optical thickness (AOT) of VIIRS was obtained and processed as a proxy for air pollution indicator. Because it is related to the particulate matter, e.g. PM2.5, concentrations in the atmosphere, AOT is widely used for air quality and pollution applications. AOT imagery is recorded and updated daily at 6 km resolution.