Results
Puerto Chiapas SEZ
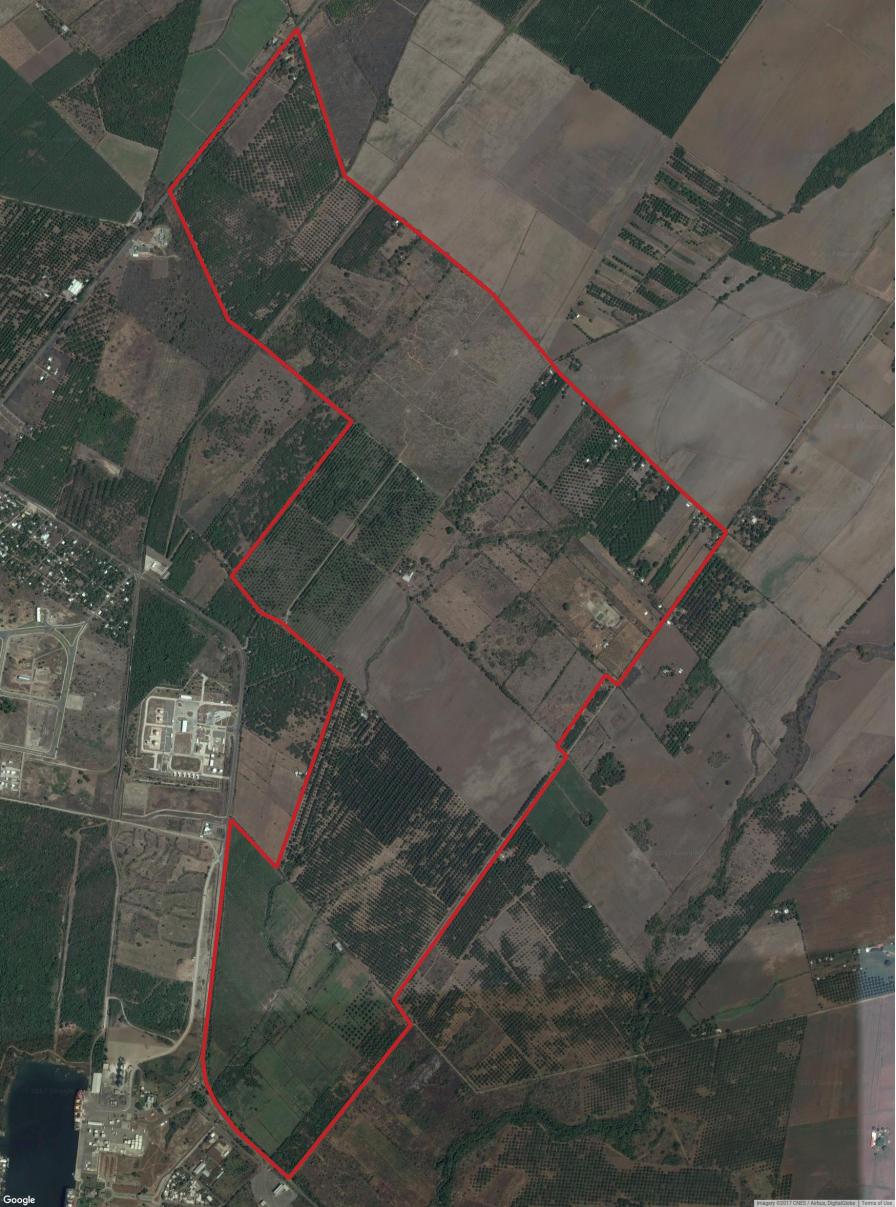
Puerto Chiapas has very recently declared as one of 3 new Zonas Economicas Especiales (ZEE) in Mexico. Established in September 2017 it spans 8216 hectares in the southern corner of Mexico, a traditionally poor region and lies directly adjacent to Puerto Chiapas port not far from the Guatemalan border.
The Puerto Chiapas SEZ is mandated to spur investments in agribusiness, with the region having a strong history of agriculture. The ZEE’s are run by private administrators on 40-year contracts with an initial focus on recruiting “anchor” tenants - key firms with long term investments.
By securing growth in agribusiness, and securing these long term commitment, the mission of the Puerto Chapas SEZ is to reduce poverty in the region and promote sustainable economic growth. The intention is that this is accompanied through energy and transportation projects as well as customs, tax and financial incentives, which the regino also desperately needs.
The Mexican ZEE’s have deliberately been set up in underdeveloped states (aiming to allow them to catch up with developed ones), and Puerto Chiapas is targeted to produce 8000 new jobs alone. Signs are purported to be encouraging, with around 200 corporations having expressed interest in establishing a presence in the ZEE’s (with 35 pursuing their interested seriously). [https://www.gob.mx/presidencia/prensa/president-enrique-pena-nieto-signs-declaratory-decrees-for-three-special-economic-zones?idiom=en]
- Size: 555 hectares
- Established: 2017
- Phase: Creation
Analysis
Success of this SEZ is set against a background of mexican regional disparity. The venture’s overarching aim is clear: to help address poverty in the country’s traditionally poorer south. This differs from other SEZs (attached as many are to major conurbations) where success can be measured against the nations broader economic expansion and increase in exports. In Puerto Chiapas success must be measured against reduction of socioeconomic disparities across the country.
To achieve this measurement of poverty reduction, job creation and infrastructural improvements are key. To this end ongoing data collection is crucial here (more so than almost all of the SEZ examined in fact).
Poverty: Measuring demographic change is extremely challenging through traditional means - surveys are expensive, logistically challenging and rapidly out of date. Here EO data and CDR datasets are key given extraction of poverty levels via these novel data streams becoming an established science ( see for example http://science.sciencemag.org/content/350/6264/1073.full).
Job Creation: Building foorprints and land use classification extracted from EO imagery gives clear insight into potential job creation - especially when combined with electricity consumption information to ensure, those buildings are in active use. However, this is highly augmented from CDR analysis, giving fine grain (and temporally profilable) measures of activity.
Infrastructure: As our phase I analysis show, regular analysis of extraction of road expansion is readily measured via skynet. While this is the prime way of measuring infrastructural improvements in the region, analysis of CDR can detect freight movement, that will reveal the successful use of that infrastructure. The micro-indicators that these data streams produce are readily combinable into a proxy for a macro-indicator that assesses whether this SEZ has indeed reduced regional disparities.
Land Classification
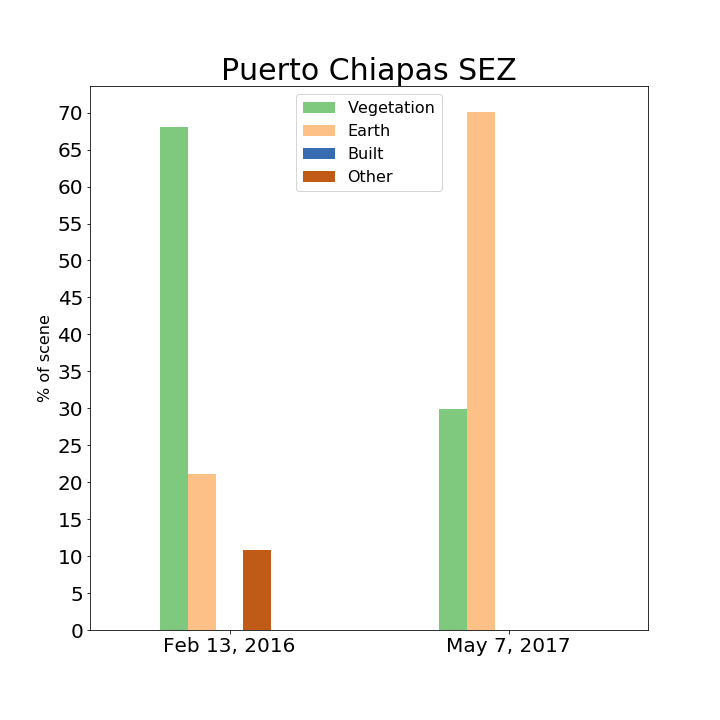
Puerto Chiapas is a very new economic zone, and as of May did not the development of any buildings or roads. However, we do see the conversion of a lot of vegetation into earth. This is possibly due to the decline of crops being grown in this zone, prior to construction efforts, but could be due to other factors.
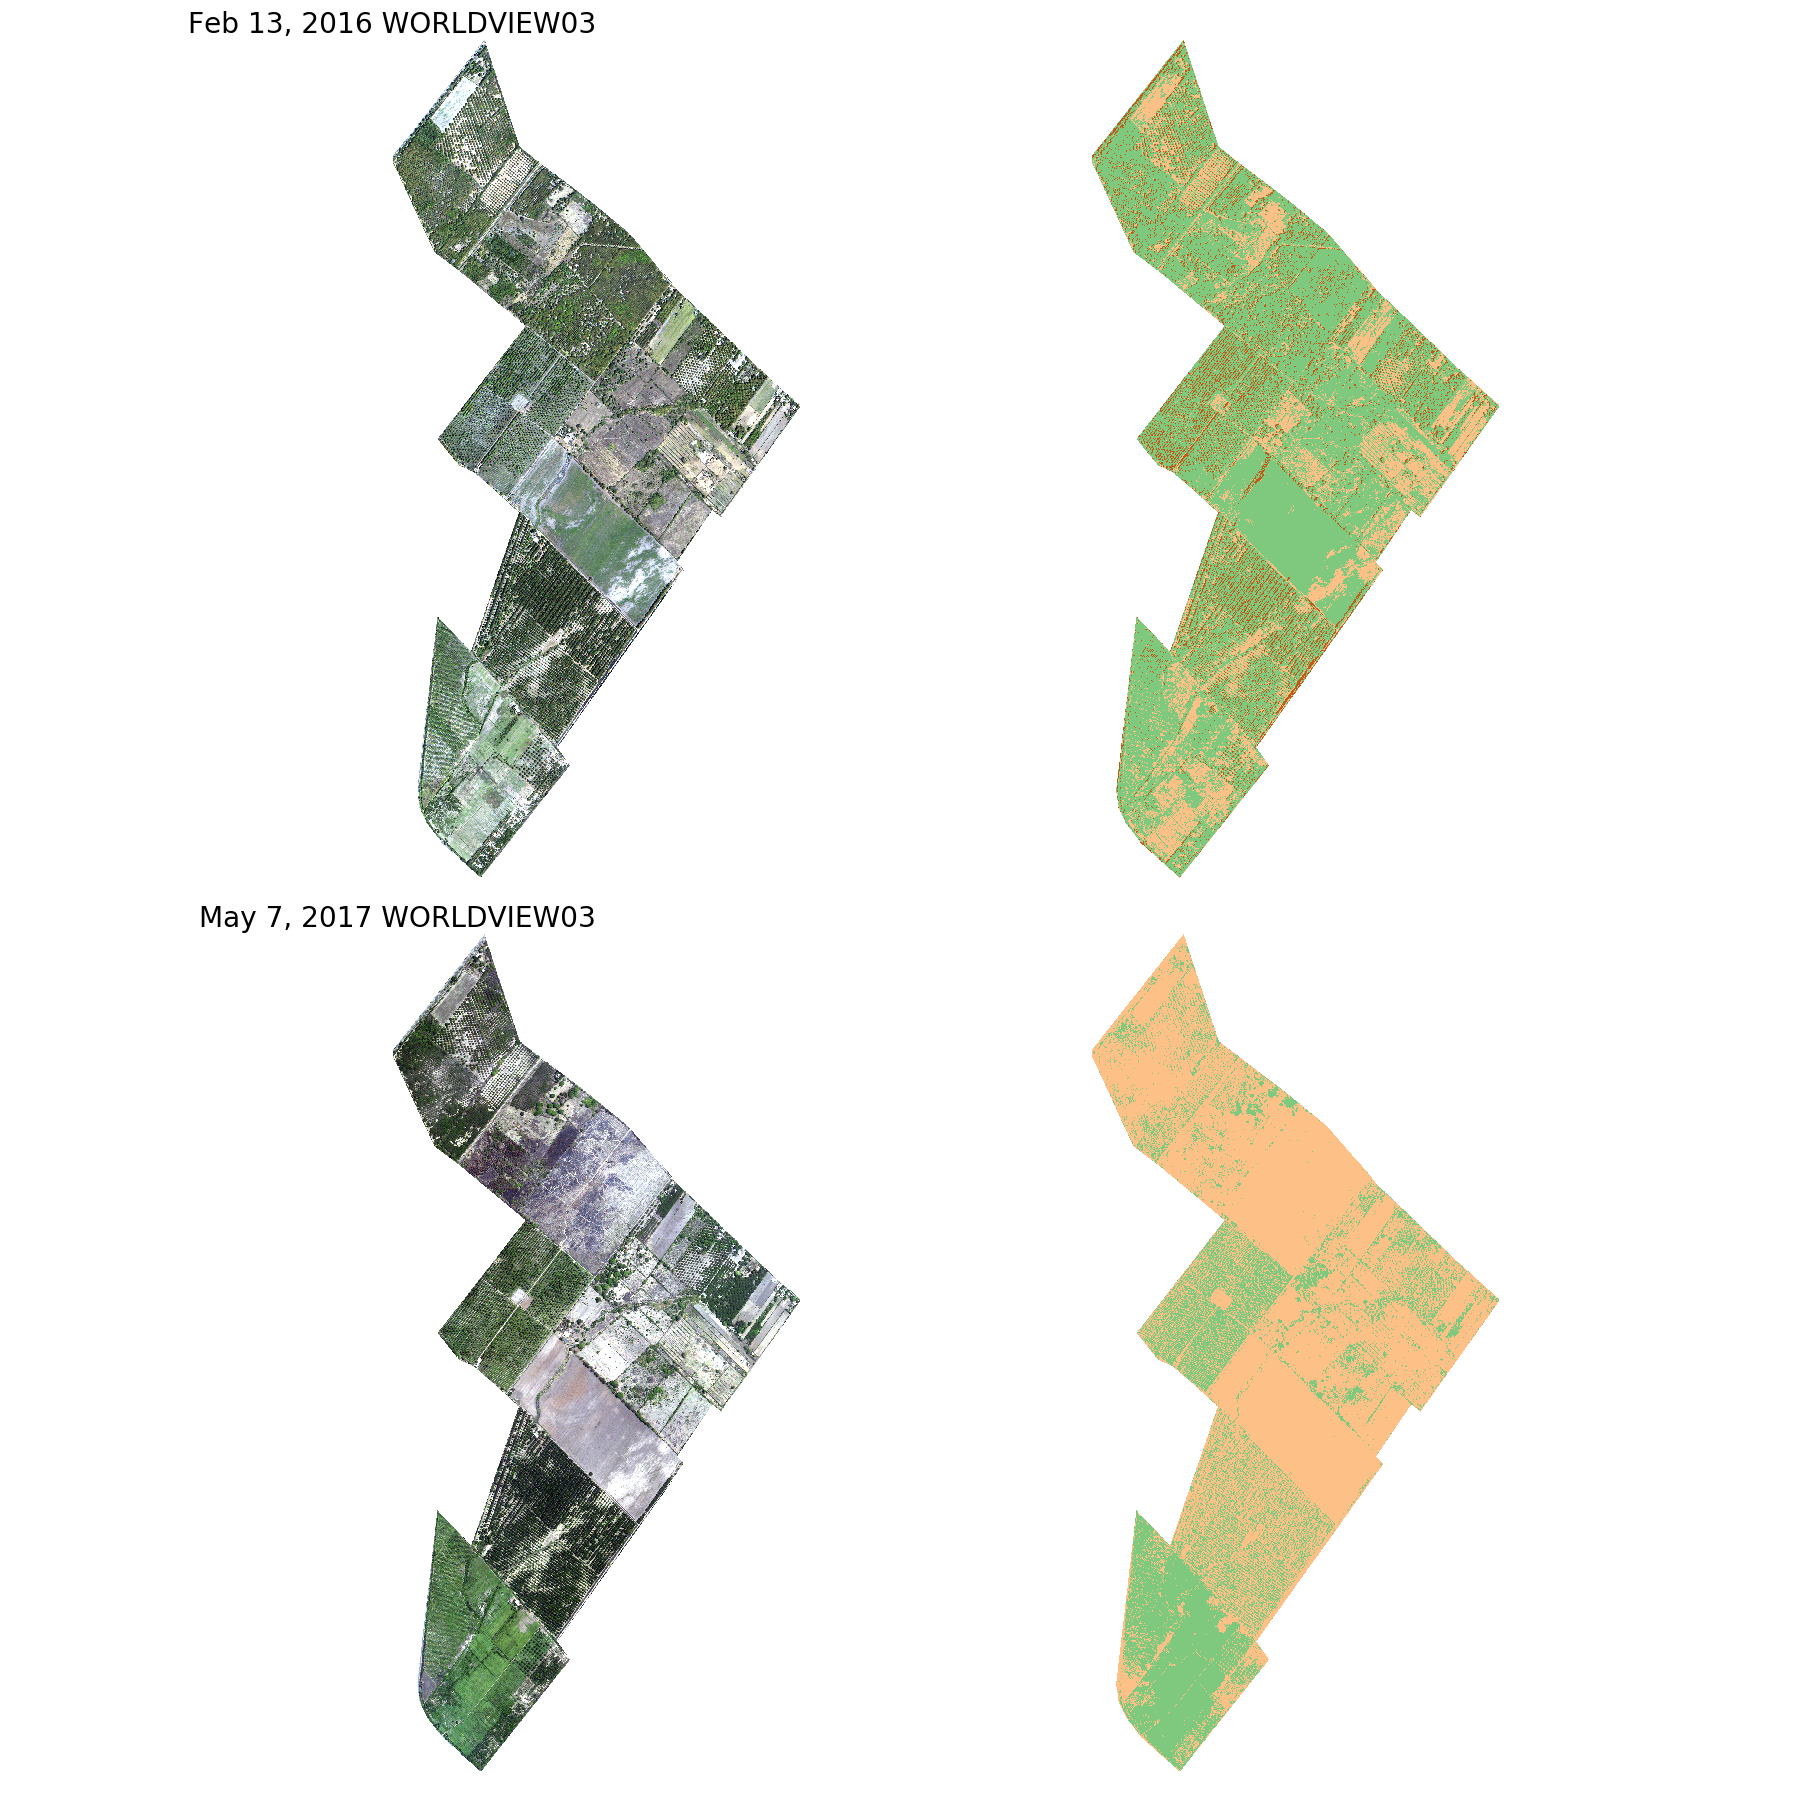
The land classification shows a clear transfer of green area (mostly farms) into earth areas, confirmed by a visual inspection.
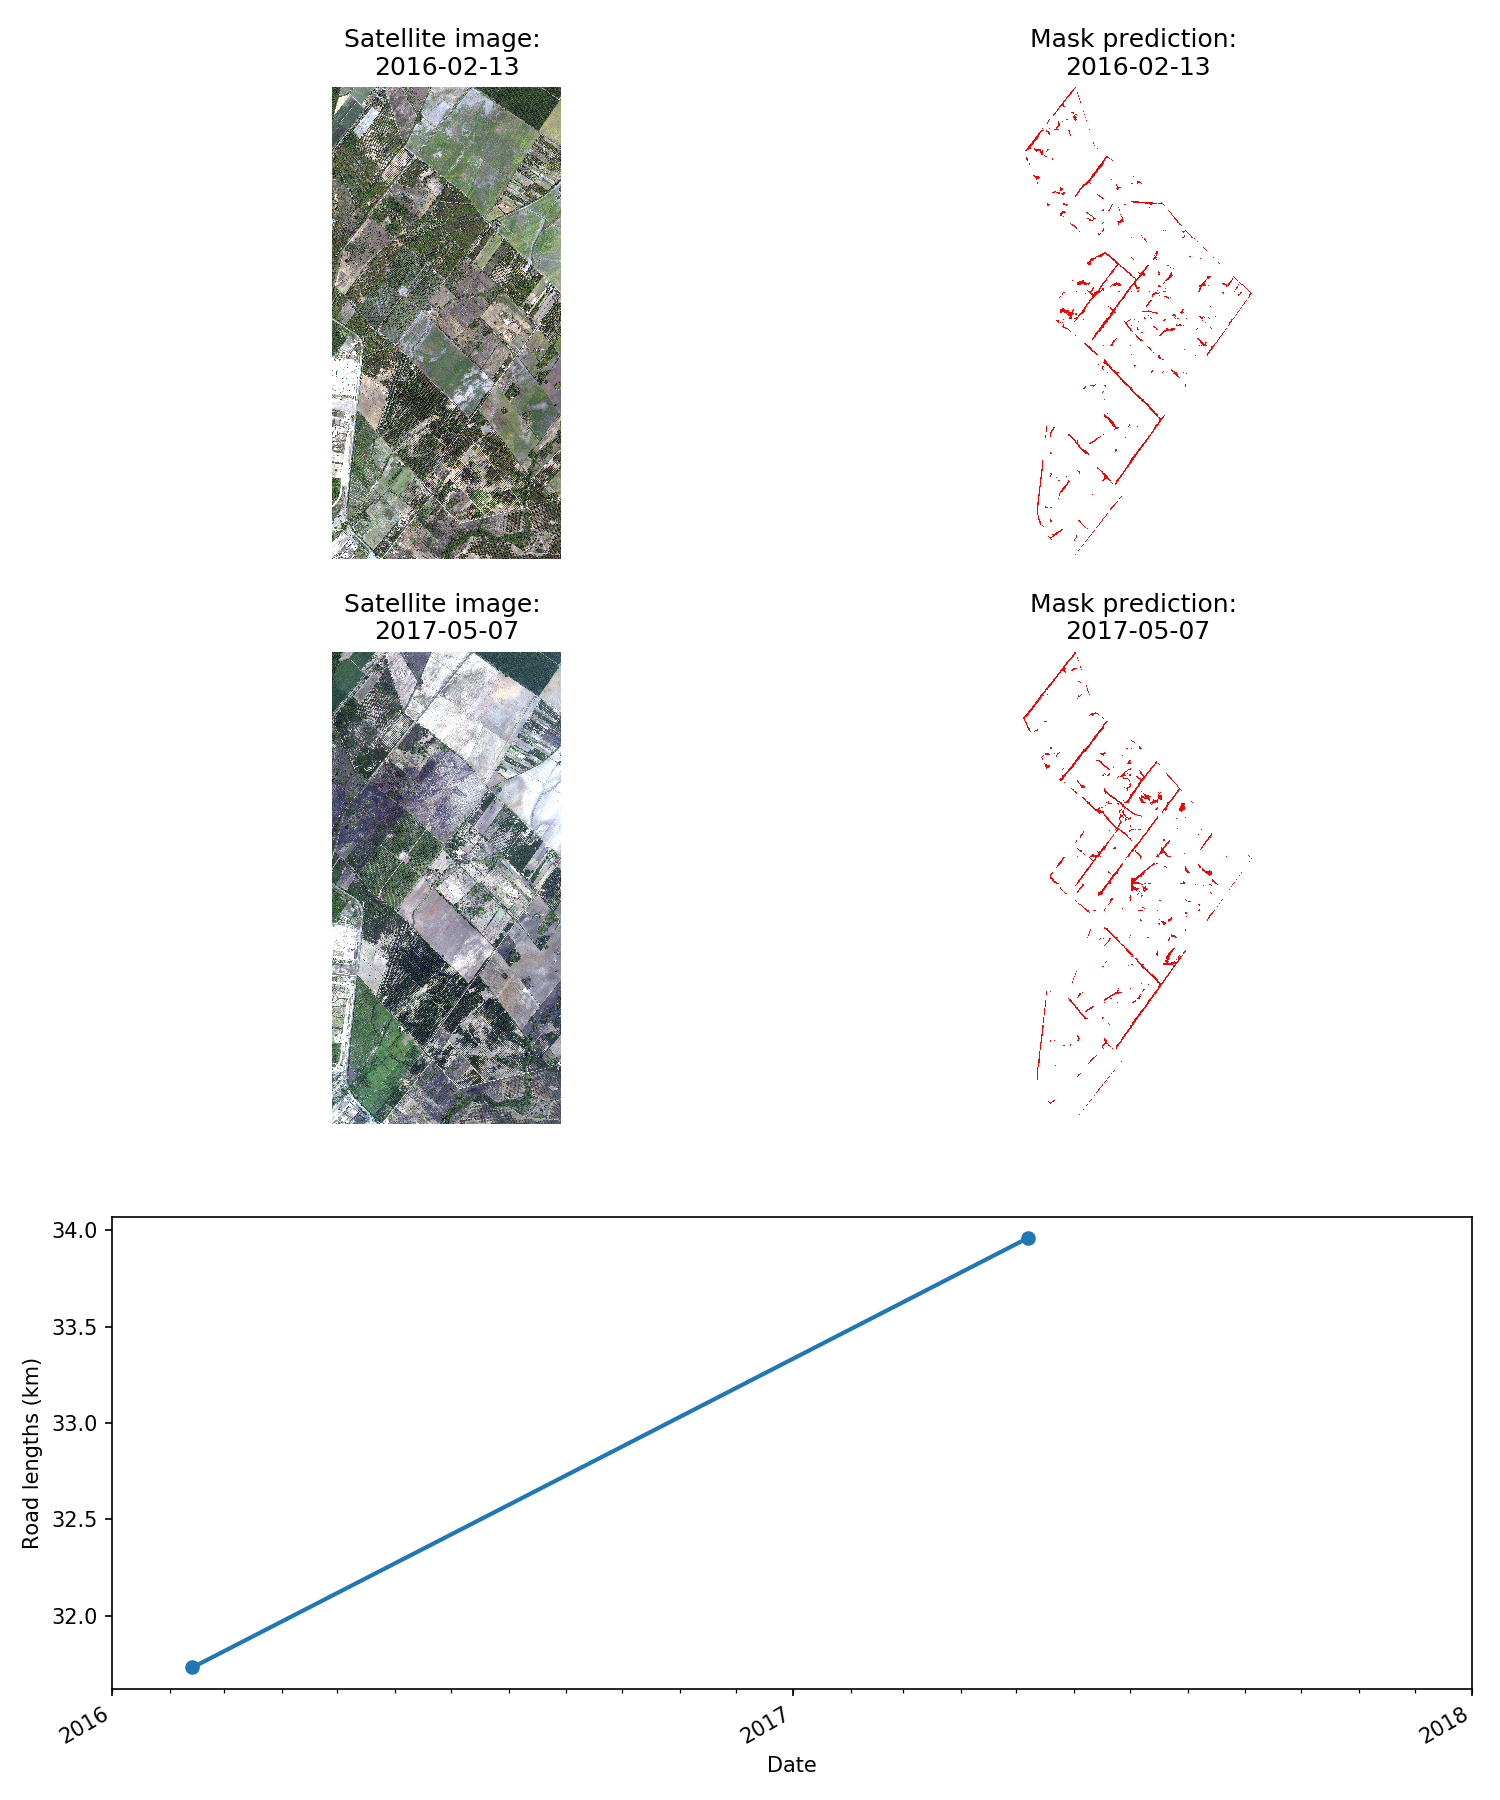
Transport Infrastructure
The total length of roadway (in km) was calculated using imagery from Digital Globe's Worldview-03 satellite. Here, Skynet gives a reasonable road mask predicting little change in the two scenes. That said, there is still room for improvement as many of the major roads were incorrectly severed in the prediction.
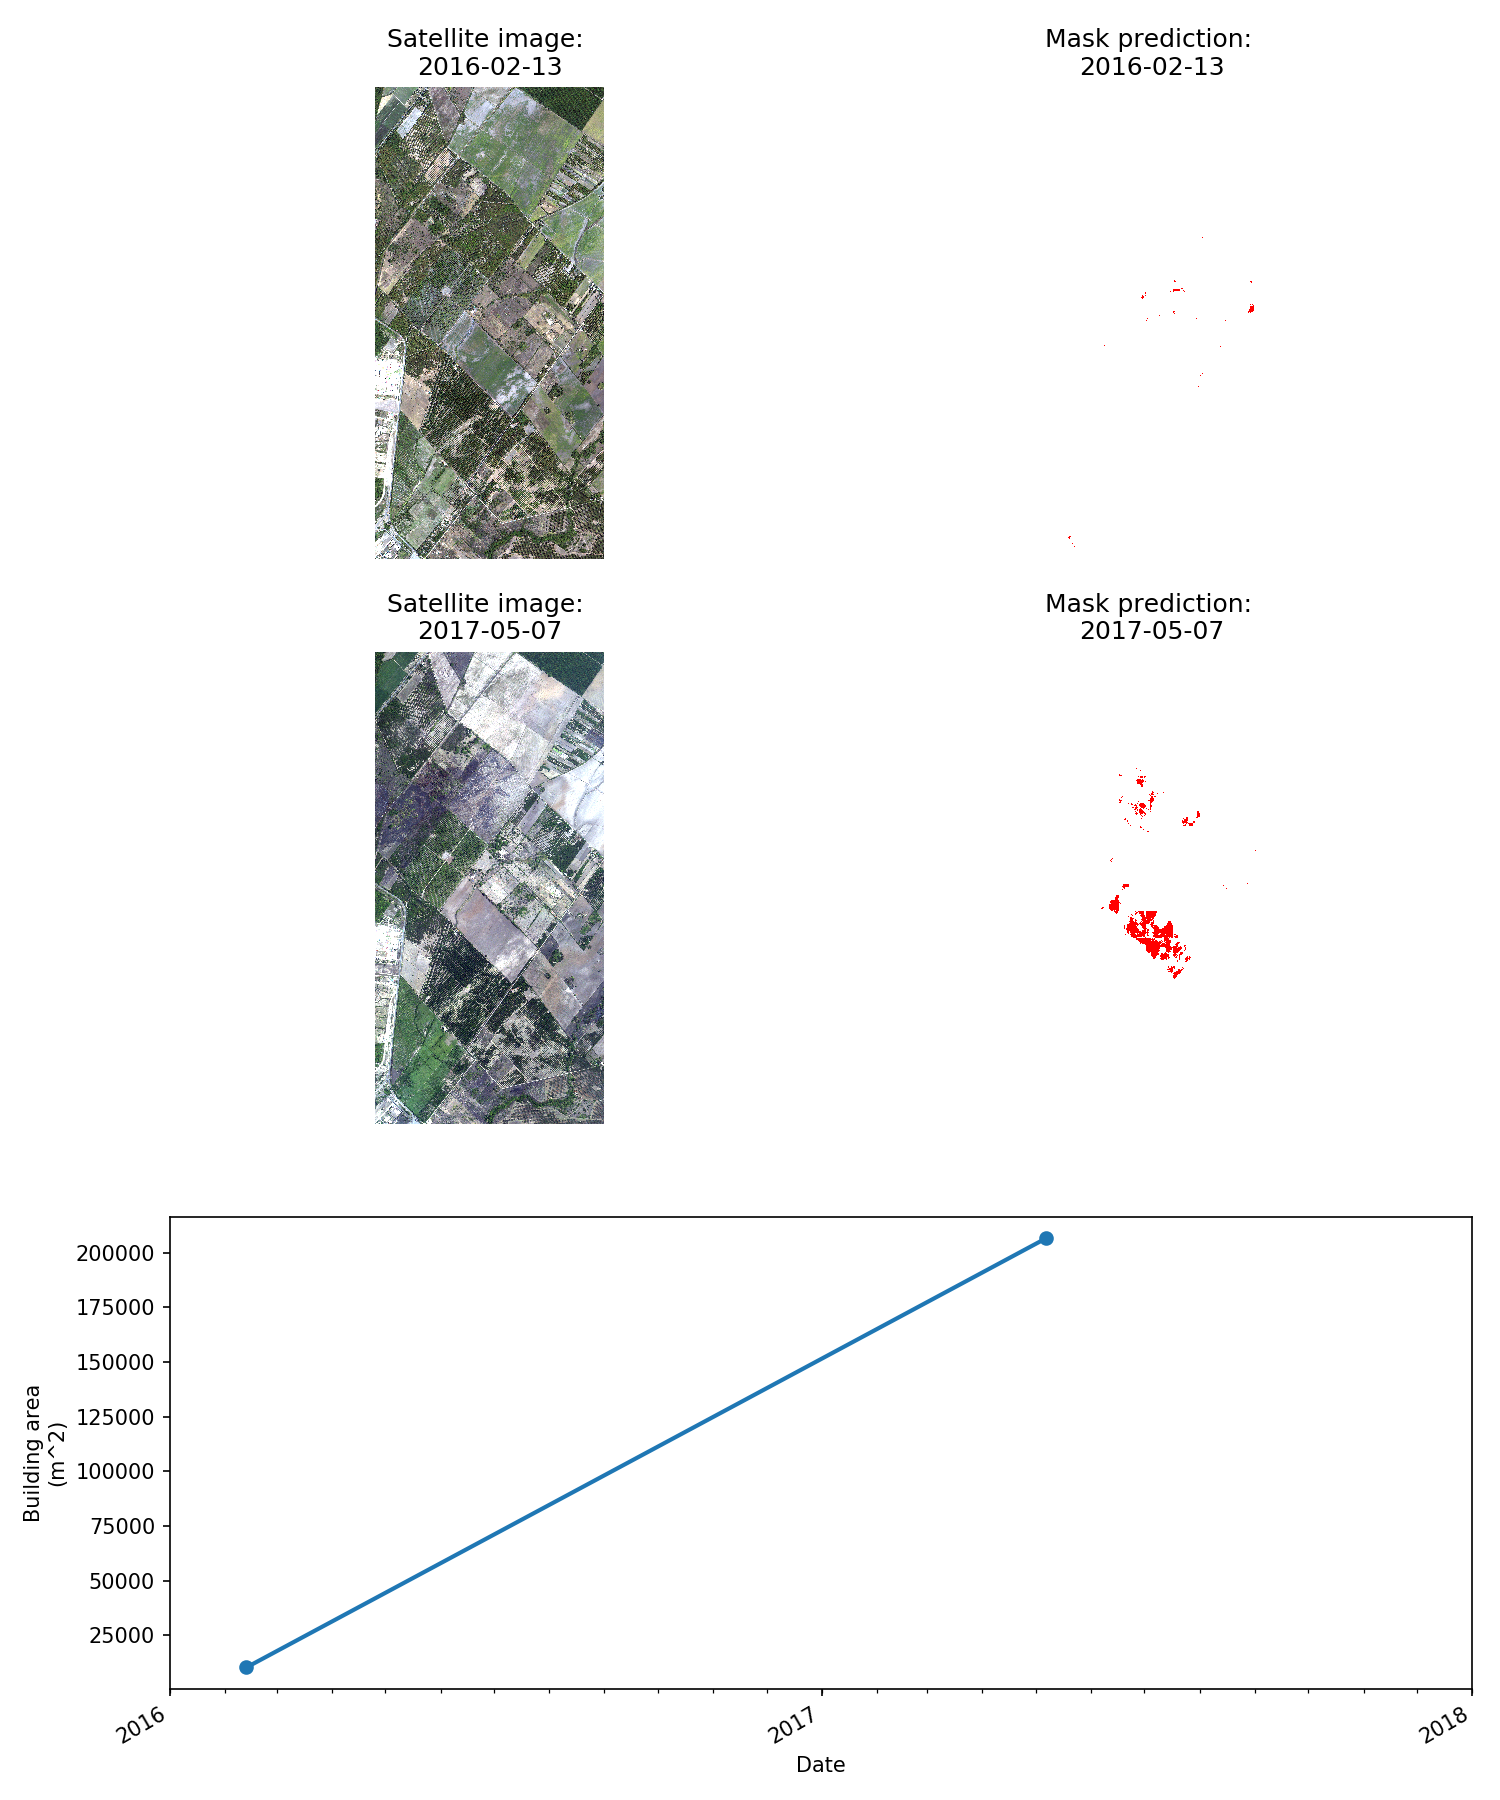
Building Footprints
The total building area (in m^2) was calculated using imagery from Digital Globe's Worldview-03 satellite. Skynet provides a reasonable building mask in that there are very few buildings. It does falsly identify one large structure in the grey-ish open area.
Building Counts
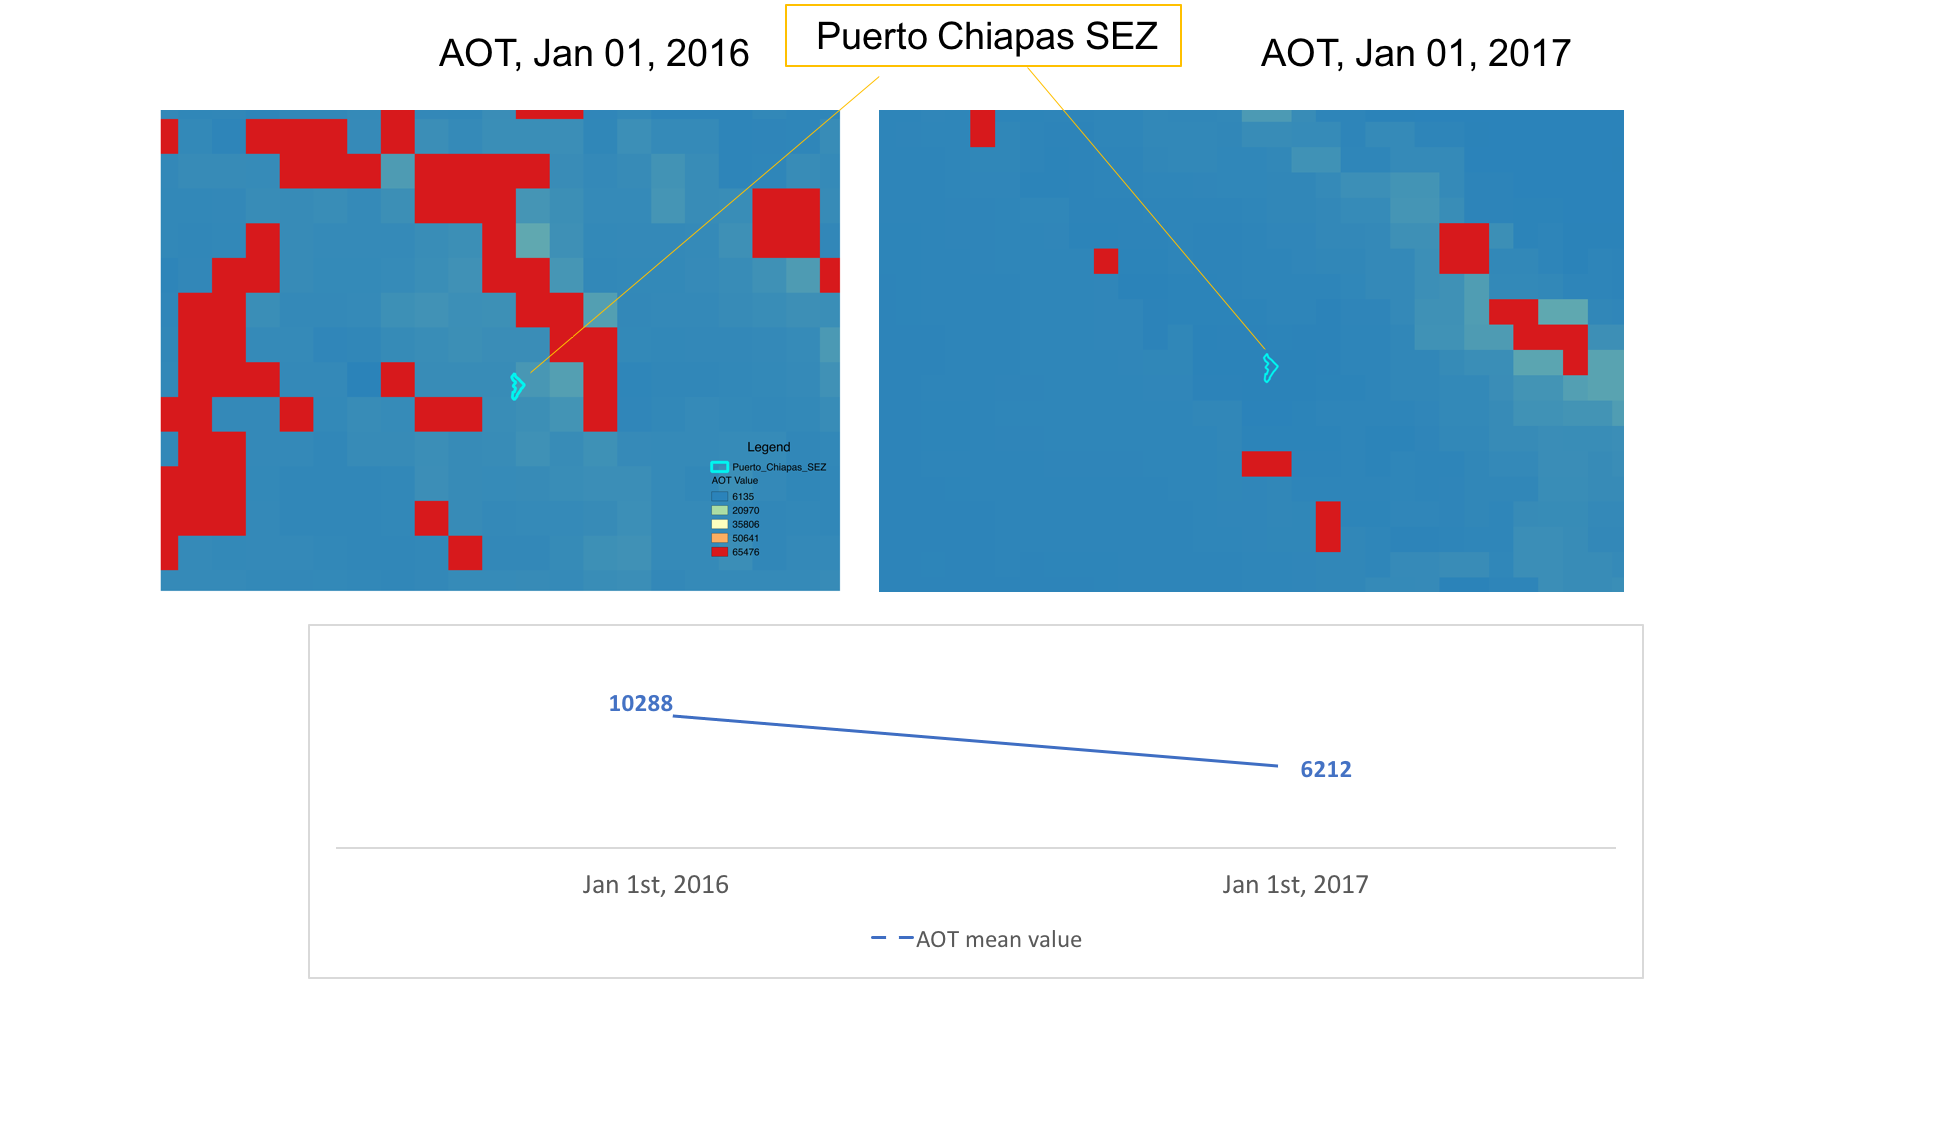
Pollution
Air quality and air pollution can also be monitored through VIIRS satellite imagery. Aerosol optical thickness (AOT) of VIIRS was obtained and processed as a proxy for air pollution indicator. Because it is related to the particulate matter, e.g. PM2.5, concentrations in the atmosphere, AOT is widely used for air quality and pollution applications. AOT imagery is recorded and updated daily at 6 km resolution.